What the model actually saw
Four documents, one summarisation, and an answer that took a while to look wrong.
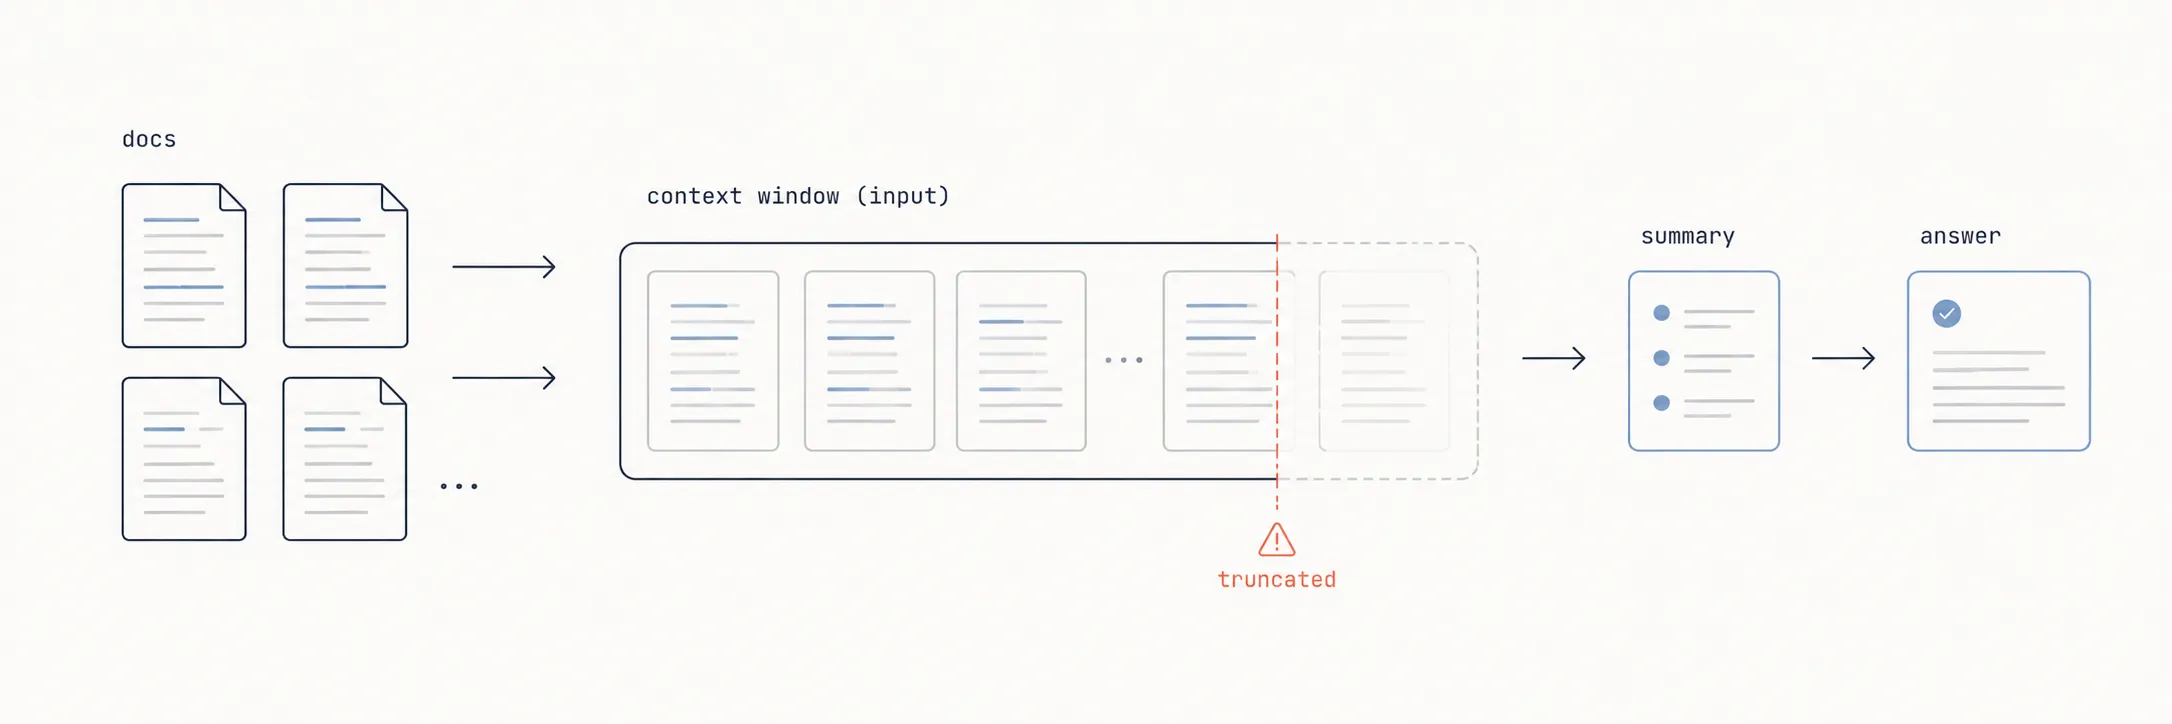
First in a series on running LLMs locally — building the things people actually build, instrumenting them, and seeing what the measurements say.
Marcus, a backend developer on a four-person platform team, has been swamped by a series of production issues over the last few days. He wants to analyse a set of incident reports that his team have collated to see what the common patterns are.
The company’s Data Protection Office had circulated a note after someone pasted a customer contract into ChatGPT, and the position since then has been simple — nothing internal goes to a third-party model, and there is no approval process to argue with.
He’s heard that it’s possible to run open-weight models locally, and his desktop happens to have a GPU with 8GB of VRAM that is unused (outside of the occasional after work gaming session), so he sets out to build a tool he can use to help analyse his backlog of reports.
First he installs Ollama (https://ollama.com/) - an open-source inference service that can run any of thousands of open-weight models.
Once that is installed he chooses a model he would like to work with - after a bit of research into modalities, quantization and parameter counts (that’s a post for another day!) he decides on the qwen2.5:7b model as one that will do the job he wants, while also fitting easily into his 8GB of VRAM.
He downloads that model by running
ollama pull qwen2.5:7bNow he’s ready to start coding
Which library
First decision: which library to use. Several options, all landing in much the same place.
Ollama exposes an API which allows developers to talk to the models. They also offer an OpenAI compatible end-point too.
So in terms of libraries for interacting with the model, his choices are
- OllamaSharp - a library specifically for Ollama’s API
- OpenAI SDK - the OpenAI SDK itself will talk to the Ollama OpenAI compatible endpoint seamlessly
- Microsoft.Extensions.AI - a Microsoft library that generalises communications with all AI providers.
- Direct hand-rolled JSON request + response shapes against the Ollama API
As he had done some personal project work before with OpenAI, he decided to stick with that library for his project. He points that SDK at localhost:11434/v1/
The reports
The reports he wants to process are sitting in a Documents folder.
He currently has four reports. They are in Markdown format and all look similar to this:
# Incident Report INC-0417 — Webhook Delivery Backlog

**Date:** 14 March 2026
**Duration:** 3 hours 12 minutes (09:48 – 13:00 UTC)
**Severity:** SEV-2
**Author:** Platform Reliability
**Status:** Closed

## Summary

Between 09:48 and 13:00 UTC on 14 March, the Halyard webhook delivery service
accumulated a backlog of approximately 41,000 undelivered events. Customer-facing
API traffic was unaffected throughout. No events were lost; all 41,000 were
delivered once the backlog drained, the last of them at 13:47 UTC, meaning some
customers received shipment status notifications up to four hours late.

## Impact

Webhook subscribers received delayed delivery of `shipment.status_changed`,
`shipment.delivered` and `rate.quoted` events. Three enterprise customers raised
support tickets. One customer's downstream reconciliation job, which runs at
12:00 UTC daily, completed against incomplete data and had to be re-run manually
by their team.

Direct API reads returned current data at all times. Customers polling the
`/v2/shipments` endpoint saw no degradation, which is why the incident was
detected late — our synthetic API monitoring was entirely green.

... truncated
The full set:
PS E:\Work\IncidentTool\Documents> ls

Mode                 LastWriteTime         Length Name
----                 -------------         ------ ----
-a----        04/08/2026     20:13           4755 01-INC-0417.md
-a----        04/08/2026     20:13           4815 02-INC-0463.md
-a----        05/08/2026     09:24           4988 03-INC-0498.md
-a----        04/08/2026     20:13           4518 04-INC-0521.md
The first version
Marcus sets to work coding, and soon he has this:
// We are using Ollama OpenAI compatible endpoint - qwen2.5:7b model
const string Endpoint = "http://localhost:11434/v1/";
const string Model = "qwen2.5:7b";

// All our incident reports are in the Documents folder
const string DocumentsFolder = "Documents";

const string SystemPrompt ="You are a reliability engineer. You summarise incident reports accurately and refer to incidents by their identifier.";

const string UserPrompt =
    "Summarise the incidents above. For each incident, give its identifier, its "
    + "duration, and its root cause in one sentence. Then identify the themes "
    + "common to all of them.";

// Read in all our Incident Reports
var documents = Directory
    .GetFiles(DocumentsFolder, "*.md")
    .OrderBy(p => p)
    .Select(p => new { Name = Path.GetFileName(p), Text = File.ReadAllText(p) })
    .ToList();

// Setup ChatClient
// Ollama needs no API key but SDK requires a non-empty one
ChatClient client = new(
    model: Model,
    credential: new ApiKeyCredential("NONE"),
    options: new OpenAIClientOptions()
    {
        Endpoint = new Uri(Endpoint)
    });

// Collate the messages we want to send to the model
// Start with the System Prompt
List<ChatMessage> chatMessages = [new SystemChatMessage(SystemPrompt)];

// Then add each document as User Prompt
foreach(var d in documents)
    chatMessages.Add(new UserChatMessage(d.Text));

// And then add the final instructional prompt
chatMessages.Add(new UserChatMessage(UserPrompt));

// Now send the messages to the model
var resp = client.CompleteChat(chatMessages);

// Print the model's answer
Console.WriteLine(resp.Value.Content[0].Text ?? string.Empty);
The result
### Incident Summaries

1. **Incident Report INC-0463**:
   - Duration: 47 minutes (04:11 – 04:58 UTC)
   - Root Cause: The incident was caused by an expired TLS certificate on the internal service mesh for two regions, which led to a complete request failure.

2. **Incident Report INC-0498**:
   - Duration: 6 hours and 5 minutes (10:20 – 16:25 UTC)
   - Root Cause: A schema migration applied during business hours took an `ACCESS EXCLUSIVE` lock on the `shipments` table, causing write operations to queue behind it.

3. **Incident Report INC-0521**:
   - Duration: 22 minutes (15:03 – 15:25 UTC)
   - Root Cause: A feature flag's default value was accidentally set to `false`, leading to a zero-priced rate quote response.

### Common Themes

1. **Configuration and Deployment Issues**: Each incident highlighted issues related to configuration or deployment, where unintended defaults led to critical failures.
2. **Monitoring Gaps**: Insufficient monitoring, either for specific metrics (like flag values) or broader system health, contributed significantly to delayed detection of the incidents.
3. **Review and Flag Management Flaws**: Lack of due diligence in reviewing flags and their deletion processes resulted in unanticipated behavior.
4. **Uncertainty Due to Partial System Changes**: Half-complete changes that left critical defaults unresolved played a significant role in all three events.

These common themes indicate systemic issues in how the team manages configurations, reviews code, performs deployments, and sets up monitoring and alerting systems.
There we go - incident summaries and common themes - nice.
But wait, what happened to INC-0417? That report was not summarised.
Was it even included in the analysis behind the Common Themes section?
And point 4 says “significant role in all three events”
The model counted. It says three. Marcus asked about four and never told it how many there were.
He only spotted it because there were four reports.
With forty, or documents he hadn’t written, the answer is correct, complete-looking, and quietly missing whatever it’s missing. So what actually reached the model?
The investigation
Let’s start with the basics. Did that report get picked up and sent to the model?
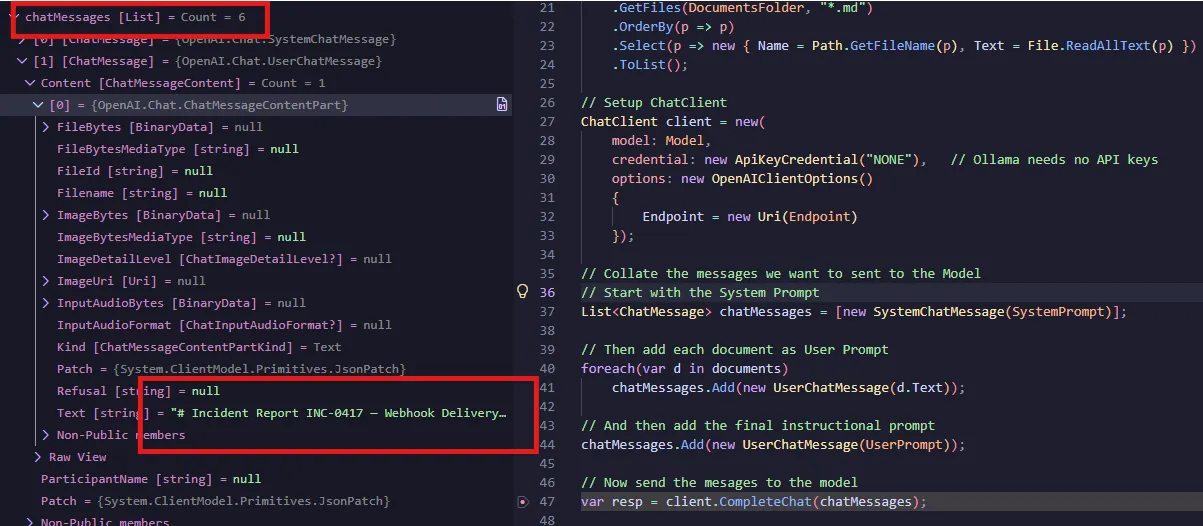
A breakpoint on the line before it is sent shows that - yes INC-0417 is there as the second chat message, immediately after the system message.
Six chat messages - System Prompt, four documents, and the User Prompt. All fine so far.
Let’s look at the response. Marcus checks the FinishReason field, which tells the caller why the model finished. We’d expect Stop under normal processing. Length or ContentFilter if the model stopped due to limits.
FinishReason : StopSo the model thought it had finished its job. What else does the response tell Marcus?
The response includes a Usage property, so Marcus prints it out.
----------------------------------------
  FinishReason         : Stop
  InputTokenCount      : 3420
  OutputTokenCount     : 371
  TotalTokenCount      : 3791
So 3420 tokens in and 371 tokens out for a total of 3791.
How many tokens was his content Marcus wondered?
Now he knows this property exists, one simple way is to send each document on its own and measure it.
int documentTokenCount = 0;
foreach (var d in documents)
{
    // Sending empty system message - if excluded completely a default one is sent and distorts the calculation
    var probe = client.CompleteChat([new SystemChatMessage(""), new UserChatMessage(d.Text)], new ChatCompletionOptions { MaxOutputTokenCount = 1});
    Console.WriteLine($"{d.Name,-20} {probe.Value.Usage.InputTokenCount,6}");
    documentTokenCount += probe.Value.Usage.InputTokenCount;
}
And the result
01-INC-0417.md         1179
02-INC-0463.md         1117
03-INC-0498.md         1175
04-INC-0521.md         1083
Ok, that is strange. These measurements total 4554 tokens. Add on a few more for the System and User prompts, and that is a lot more than the 3420 it reported receiving.
The shortfall is 1,134 tokens. INC-0417 measured 1,179.
So the code definitely sent the document. The model returned a normal FinishReason. But the token count says roughly one document’s worth never arrived — 1,134 tokens missing, against INC-0417’s measured 1,179.
Nothing in Marcus’s code is wrong. Nothing in the response says anything failed. And a quarter of the input isn’t there.
The culprit
Marcus starts to search for information about this, and this takes him to https://docs.ollama.com/context-length
Context Length controls the maximum number of tokens an LLM can process at one time for a single request - and this covers input and output together. It is represented by a number of tokens - but this does not equate to text size in terms of memory requirements. A 4k Context Length needs 224 MiB of VRAM per concurrent request for the model Marcus is using, and this would increase to 1.8 GiB for a 32k Context Size.
For a GPU with under 24GiB VRAM, the default is 4k.
This is confirmed by running ollama ps while the model is running
PS C:\Users\spenc> ollama ps
NAME          ID              SIZE      PROCESSOR    CONTEXT    UNTIL
qwen2.5:7b    845dbda0ea48    4.7 GB    100% GPU     4096       4 minutes from now
Marcus infers that this is why one of his documents was skipped. Three documents fit under the 4k limit, the fourth pushes it over, and causes the earliest one to get dropped.
Marcus moves the slider up to a Context Length of 8k - while being wary of the comment about ensuring he has enough VRAM.
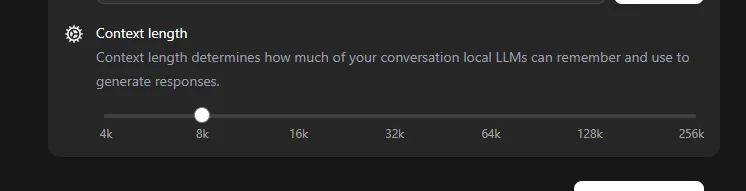
He runs the tool again.
### Incident Summaries

1. **Incident Report INC-0417 — Webhook Delivery Backlog**
   - **Identifier:** INC-0417
   - **Duration:** 3 hours 12 minutes (09:48 – 13:00 UTC)
   - **Root Cause:** The persistence refactor in the webhook dispatcher introduced a `DbContext` without disposing, causing connection pool saturation and delivering webhooks late.

2. **Incident Report INC-0463 — Regional Service Mesh Outage**
   - **Identifier:** INC-0463
   - **Duration:** 47 minutes (04:11 – 04:58 UTC)
   - **Root Cause:** An internal service mesh certificate expired, causing TLS handshake failures in two regions and resulting in HTTP 503 responses.

3. **Incident Report INC-0498 — Shipments Table Lock Contention**
   - **Identifier:** INC-0498
   - **Duration:** 6 hours 5 minutes (10:20 – 16:25 UTC)
   - **Root Cause:** A schema migration acquired an `ACCESS EXCLUSIVE` lock on the `shipments` table, causing all downstream queries to queue and timeout.

4. **Incident Report INC-0521 — Zero-Priced Rate Quotes**
   - **Identifier:** INC-0521
   - **Duration:** 22 minutes (15:03 – 15:25 UTC)
   - **Root Cause:** A deprecated feature flag's code default was changed to `false`, causing the rating engine to return zero prices for unaffected lanes.

### Common Themes Among All Incidents

1. **Incomplete Flag Management**: The incidents highlight a common issue with how flags are managed during large software changes, where removing configurations but forgetting to update code leads to silent failures.

2. **Misleading Alerts and Metrics**: Inaccurate or insufficient alerting mechanisms failed to surface the issues in time, contributing significantly to the duration of the incidents.

3. **Dependency on Default Values**: Changes that defaulted unexpectedly due to shifts in configuration or flag state led to critical failures without proper validation.

4. **Manual Recovery Over Automated Resolution**: None of these incidents had automated remediation pathways, leading to manual intervention which was slow and error-prone.

5. **Lack of Comprehensive Monitoring**: Critical aspects such as quote prices, specific regions' health, large table locks, and TLS certificate expirations lacked proper monitoring or insufficient threshold-based alerts.

----------------------------------------
  FinishReason         : Stop
  InputTokenCount      : 4591
  OutputTokenCount     : 536
  TotalTokenCount      : 5127
Ok, that is looking much better. We now have a summary of all four documents, and his instrumentation panel at the end tells a different story now.
The conclusion and future
Marcus had one document silently dropped from his input.
Nothing lied to Marcus. FinishReason: Stop was accurate — the model did stop normally. InputTokenCount: 3420 was accurate — that’s genuinely what it processed. The debugger was accurate. Every single signal was correct, and together they described a successful call that had lost a quarter of its input. There was no error to catch because, by every component’s own lights, nothing failed.
To avoid this happening again later when more documents get added, Marcus adds a guard.
// Expect tokens = total from documents
int expectedTokens = documentTokenCount;

// Anything smaller than the smallest document is template noise plus a bit for prompts.
const int Tolerance = 200;

if (expectedTokens - resp.Value.Usage.InputTokenCount > Tolerance)
    throw new InvalidOperationException(
        $"Input truncated: expected {expectedTokens}, " +
        $"model received {resp.Value.Usage.InputTokenCount}.");
The check doesn’t need to be exact. Message pruning drops whole documents [ollama/issues/17427], so the smallest thing it can lose is 1,083 tokens. The tolerance only has to be larger than template noise and user/system prompts and smaller than a document.
He can’t detect this by reading the answer. He detects it by comparing what he sent against what the response says arrived.
Next: What the model was thinking — a newer model, the same four reports, the same answer, and twenty times the tokens to produce it.