Squeezing the juice
How many things can an 8GB card do at once? Fewer than it will let you ask for. In this post I benchmark parallelism in a local llm
Third part in a series on running LLMs locally — building the things people actually build, instrumenting them, and seeing what the measurements say.
Previous: What the model was thinking — Qwen reasoning tokens, cost, and latency
While working on a harness that had me calling a local LLM in a loop, watching it churn away and the GPU temperature rising, I wondered if there was any scope for parallelisation.
Anyone who has worked with APIs and Databases will be familiar with the diminishing returns parallelisation offers. At first it’s all good but once you increase the levels, you start to trade performance for instability in the way of database locks, network time-outs, and resource contention.
But are LLMs different? Everything is already in memory, so there is no disk or network I/O. It is “just” moving memory around very fast and doing trillions of arithmetic operations in parallel. So does increasing the amount of work being done in parallel scale — and eventually degrade — in the same way?
It seems like my locally-running LLM is already working overtime on a single request, so how much juice can I squeeze out of it?
I stopped what I was doing and decided to investigate.
The setup
Everything here is from a single 8 GB RTX 3070. Enterprise on-premise inference typically runs on datacentre parts like NVIDIA’s A100 or H100, with far more VRAM and several times the memory bandwidth — so the absolute numbers won’t transfer. The method should, but I make no claims the same patterns would be seen in dedicated hardware.
First question - does Ollama support parallelisation? Of course the answer is yes.
https://docs.ollama.com/faq#how-does-ollama-handle-concurrent-requests
A number of environment variables can be used to fine-tune concurrency.
OLLAMA_NUM_PARALLEL - This decides the maximum number of slots (parallel instances) that can run at once.
OLLAMA_MAX_LOADED_MODELS - This controls the maximum number of different models that can be loaded at once. The default is “3 * GPUs”. For my tests I’m using the same model each time, so this isn’t a factor. But loading 3, of all but the smallest models, would not be possible on 8GB, so that default is quite high.
OLLAMA_MAX_QUEUE - This controls how many requests can be backed up before Ollama rejects them. This is pure HTTP/API logic as we are used to with Kestrel thread-pools and DB connection pools.
For my tests I used the Qwen2.5-7B (Q4_K_M, 4.7GB) model (https://ollama.com/library/qwen2.5:7b and https://huggingface.co/Qwen/Qwen2.5-7B-Instruct). This model does not have thinking or vision capabilities and starts off at 4.7GB in size for one slot.
Each ‘slot’ has a fixed memory overhead that is taken at the point the model is loaded. So if the value is set to 6 but I only use 2 at once - the memory for the other 4 is already allocated in VRAM. If you assign too many slots, the model overflows some layers onto system ram and CPU compute; this is very very bad for performance.
So the upper limit of OLLAMA_NUM_PARALLEL can be obtained before starting; it is the point where the model and all slots can fit in VRAM 100%. With a context length of 4096 tokens, each slot requires approximately 224 MiB. The calculation for that is:
2 × layers × kv_heads × head_dim × context × bytes_per_elementFor qwen2.5:7b that is:
2 x 28 x 4 x 128 x 4096 x 2 bytes = 224 MiBThe Ollama logs showing that calculated value:
          | total   free    self   model   context   compute
 - CUDA0  |  8191 = 7113 + (4528 =  4168 +     224 +     136)
 - Host   |                  310 =   292 +       0 +      18

1 slot:  size = 224.00 MiB (4096 cells, 28 layers, 1/1 seqs)
8 slots: size = 1792.00 MiB (4096 cells, 28 layers, 8/8 seqs)
By setting the parallelisation parameter, loading the model and running ollama ps you can see the point at which the overflow happens:
PS C:\Users\spenc> $env:OLLAMA_NUM_PARALLEL=7; $env:OLLAMA_CONTEXT_LENGTH=4096; ollama serve

PS C:\Users\spenc> ollama ps
NAME          ID              SIZE      PROCESSOR    CONTEXT
qwen2.5:7b    845dbda0ea48    6.2 GB    100% GPU     4096

PS C:\Users\spenc> $env:OLLAMA_NUM_PARALLEL=8; $env:OLLAMA_CONTEXT_LENGTH=4096; ollama serve

PS C:\Users\spenc> ollama ps
NAME          ID              SIZE      PROCESSOR         CONTEXT
qwen2.5:7b    845dbda0ea48    6.8 GB    8%/92% CPU/GPU    4096
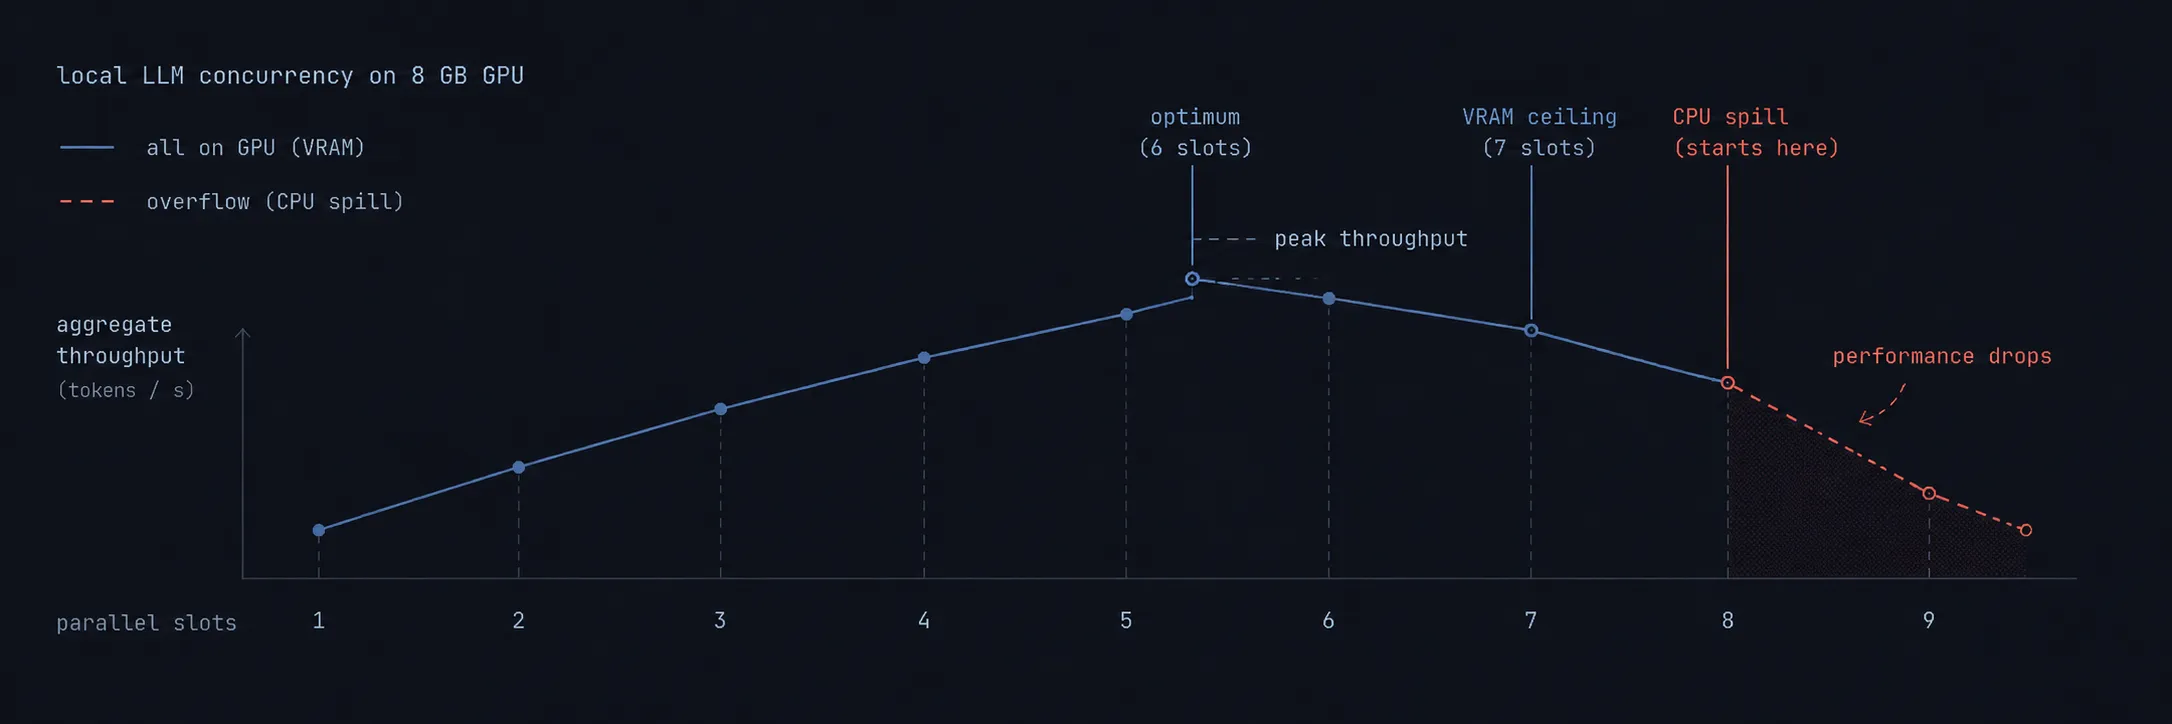
In the above example, 7 slots requires 6.2 GB VRAM, increasing to 8 slots shows 6.8 GB VRAM needed, and now some is being offloaded onto CPU and system memory - 8% overflow.
So for my tests - 7 slots is the maximum where everything stays in VRAM. For 8 and beyond, performance drops off a cliff. That gives us the ceiling - whether it’s the right number is a separate question, and the answer turns out to be no.
The method
The testing method is quite simple:
- A System Prompt - “You are a budding author”
- A User Prompt - “Generate a diary entry for a soldier in world war one”
- Fixed sampling parameters:
- Temperature : 0
- Seed : 42
- TopK: 20
- TopP: 0.95
- One “warm-up” call to model before instrumented tests start.
A few Ollama settings:
OLLAMA_KEEP_ALIVE= 30m - Keeps the model loaded for 30 minutes so it doesn’t unload mid run.OLLAMA_CONTEXT_LENGTH= 4096 - As my calculations showed that I could fit 7 slots at 4k context. 4k is more than enough for the prompt and output of this test though.
To apply these, and for ease of increasing the parallelism settings I used this command to start a clean instance of Ollama:
$env:OLLAMA_HOST="0.0.0.0:11436"; $env:OLLAMA_NUM_PARALLEL=1; $env:OLLAMA_CONTEXT_LENGTH=4096; $env:OLLAMA_KEEP_ALIVE="30m"; ollama serveThe code then ran through 30 instances of running the same system and user prompt - spread across “n” parallel tasks:
await Parallel.ForEachAsync(Enumerable.Range(0, benchmark.Runs), new ParallelOptions { MaxDegreeOfParallelism = benchmark.MaxParallel },
    async (index, cancellationToken) =>
    {
        try
        {
            // Perform a single generation and store results
            var request = new LlmRequest(SystemPrompt, UserPrompt,
                                         SamplingOptions.Deterministic);
            var result = await llm.CompleteAsync(request, cancellationToken);
            results[index] = result;

            if (!result.Succeeded)
            {
                Console.WriteLine($"{name}  failed: {result.Error}");
                return;
            }
        }
        catch (Exception ex)
        {
            Console.WriteLine($"diary_{index + 1:D2}  failed: {ex.Message}");
        }
    });
After each run - I note the results down, and then increase the parallelism counter on Ollama and in my config file, and then run again.
Results Set 1
The two throughput columns measure different things, and the difference is the point of the exercise. Per-slot is decode rate for one request; aggregate is what the machine delivered across all thirty. The last column counts how many different answers came back from thirty identical requests, which at temperature 0 with a fixed seed ought to be one.
| Slots | Avg (ms) | StDev (ms) | Wall (s) | Memory (GB) | GPU % | Per-slot tok/s | Aggregate tok/s | Distinct outputs |
|---|---|---|---|---|---|---|---|---|
| 1 | 6,301 | 93 | 192 | 4.7 | 100 | 76.0 | 76 | 1 |
| 2 | 7,279 | 416 | 110 | 5.1 | 100 | 67.6 | 133 | 2 |
| 3 | 8,742 | 609 | 88 | 5.2 | 100 | 57.7 | 166 | 11 |
| 4 | 10,440 | 965 | 84 | 5.5 | 100 | 47.7 | 174 | 20 |
| 5 | 11,692 | 1,465 | 73 | 5.7 | 100 | 41.3 | 200 | 30 |
| 6 | 13,848 | 1,193 | 71 | 5.9 | 100 | 35.5 | 206 | 30 |
| 7 | 16,268 | 2,129 | 76 | 6.2 | 100 | 30.3 | 192 | 30 |
| 8 | 23,863 | 2,258 | 96 | 6.8 | 92 | 20.1 | 152 | 30 |
| 9 | 28,058 | 3,331 | 103 | 7.0 | 89 | 17.1 | 142 | 29 |
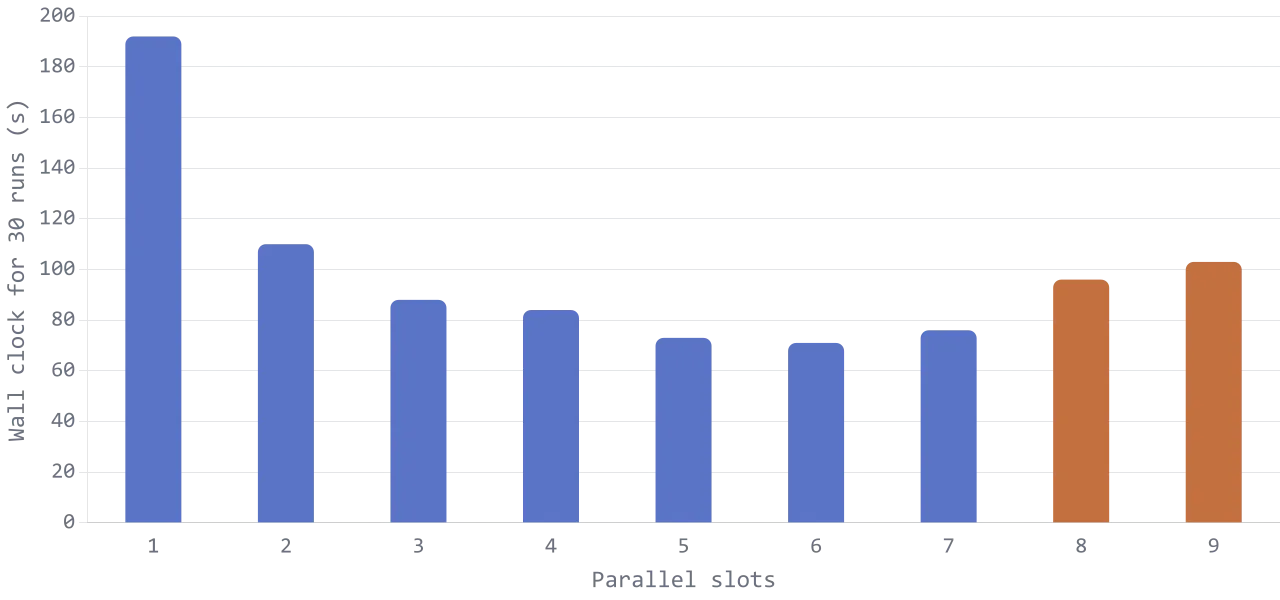
The below chart shows the wall clock time for 30 generations. The orange are where some layers started getting offloaded to CPU
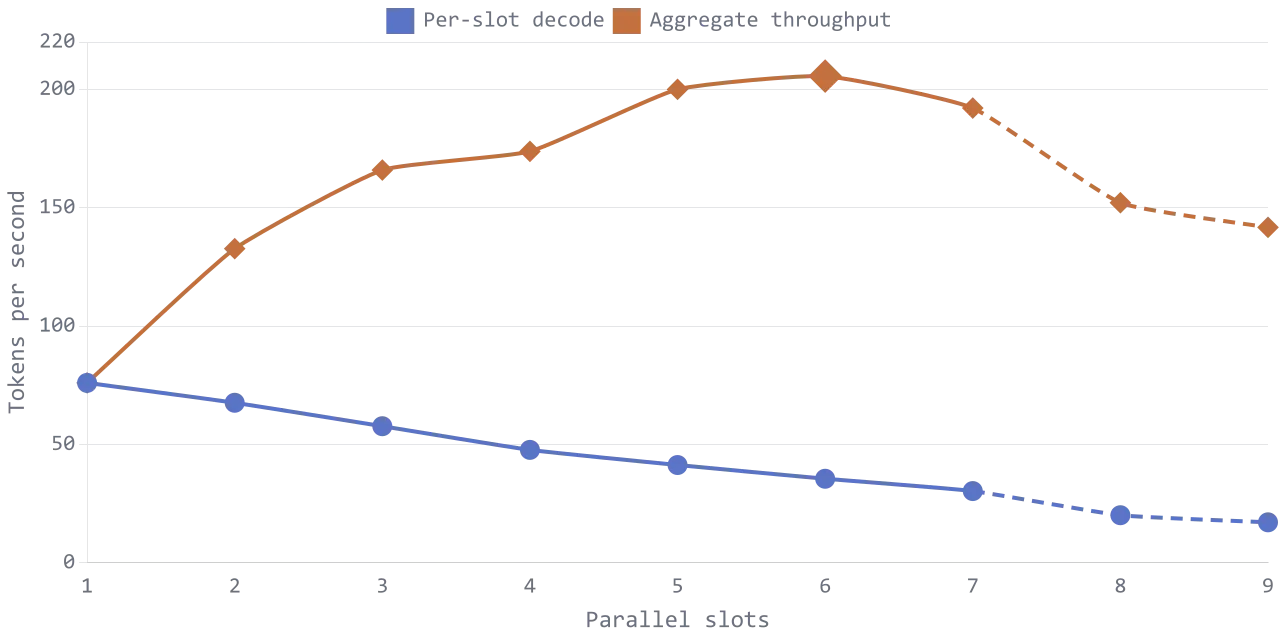
The below chart shows the aggregate throughput vs the average per-slot decode. With aggregate throughput peaking at 6 slots and per-slot throughput degrading at a steady pace.
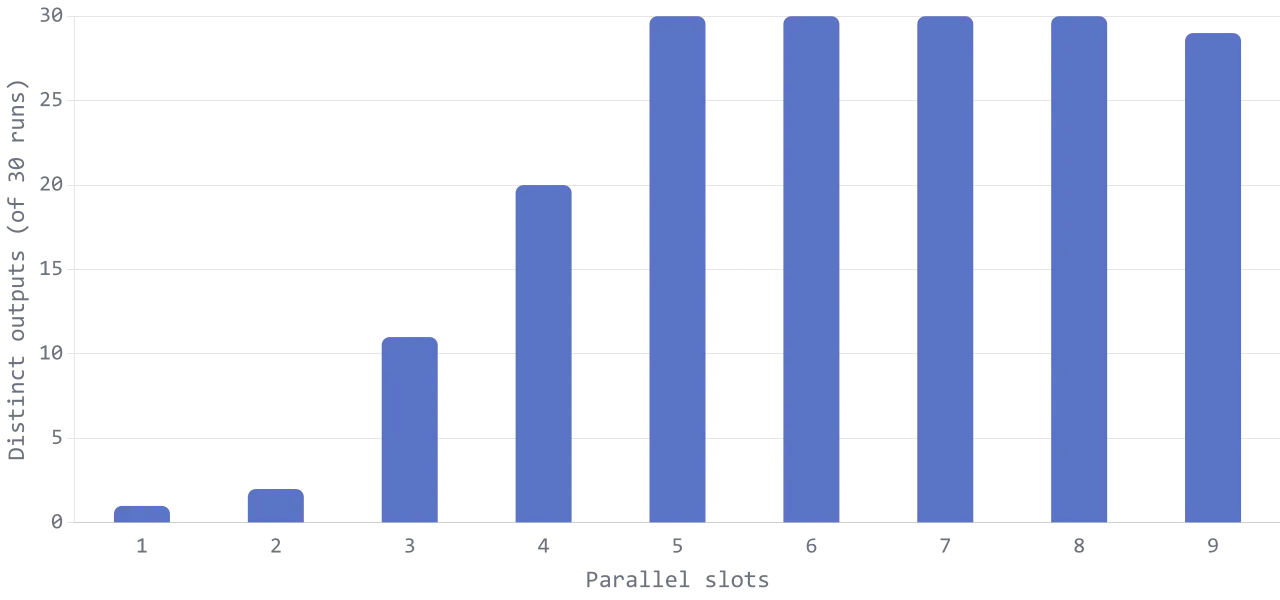
The below chart is the interesting finding. It counts how many different answers came back. With determinism, this should always be one, but as more slots were added the worse it got. The visible outcome for this is that the output text about 1/3 of the way through started to diverge.
Temperature 0 means the model always takes the highest-probability token — there’s no sampling, so the seed is never used and there’s no randomness to blame. The usual explanation is that running several sequences at once changes the order in which the GPU sums its operations, shifting results in their final bits. When the top two candidates are nearly tied, that’s enough to flip which one wins, and from there the two runs are writing different text. That explaination fits what I measured: the openings are always identical. See: https://thinkingmachines.ai/blog/defeating-nondeterminism-in-llm-inference/ for a clearer description.
Same prompt, temperature zero, thirty runs: by five parallel slots, all thirty outputs were different.
Results Set 2
For the second run, I wanted to add in another dimension to test. Set 1 had a very basic input so there was no point measuring the input throughput.
So I changed the System Prompt to be a detailed “back story” for the soldier who the diary was for. This amounted to about 1430 tokens of input, and as a direct result meant the wall-time for individual generations was significantly longer than set 1.
I also set the LLAMA_ARG_CACHE_RAM variable to 0 - (A llama.cpp variable not Ollama). llama.cpp keeps a RAM-backed store of idle slot states so a later request with a matching prefix can skip prefill. That’s a sensible optimisation but not good when I am wanting to measure prefill, so it’s disabled.
There’s a second mechanism with no flag at all: a slot still holds the KV cache from its own previous request, and llama.cpp matches each new prompt against it by its prefix. With an identical system prompt every time, the cache was used, and model reported back a prefill rate of 107,000 tokens per second, which is an impossible number to reach on a 3070.
The fix is to make every prompt different at the very first token, by prefixing each system prompt with a fresh GUID. Prefill came back at around 3,300 tok/s, which is what a 3070 is capable of. The cost is that the outputs now differ by construction, so no determinism checks can be made — that result belongs to Set 1, where the prompts really were identical.
I also set Max Output Tokens (num_predict) to 1,750 as I had a couple of runaway executions where the model got into a loop. This limits output to a level above the expected output level, so is just a safety mechanism.
Set 1 didn’t need any of this because its total input was only 29 tokens, so caching and prefill rates were a minuscule percentage of timings.
| Slots | Avg (ms) | StDev (ms) | Wall (s) | Memory (GB) | GPU % | Prefill tok/s | Per-slot tok/s | Aggregate tok/s |
|---|---|---|---|---|---|---|---|---|
| 1 | 10,162 | 1,703 | 304 | 4.7 | 100 | 3,332 | 76.2 | 72 |
| 2 | 12,916 | 1,837 | 194 | 5.1 | 100 | 3,040 | 64.8 | 123 |
| 3 | 15,258 | 2,313 | 154 | 5.2 | 100 | 2,674 | 54.4 | 153 |
| 4 | 18,367 | 2,842 | 143 | 5.5 | 100 | 2,660 | 45.3 | 165 |
| 5 | 22,973 | 4,172 | 142 | 5.7 | 100 | 2,375 | 36.2 | 167 |
| 6 | 26,361 | 4,006 | 135 | 5.9 | 100 | 2,467 | 32.2 | 180 |
| 7 | 30,483 | 5,778 | 142 | 6.2 | 100 | 2,295 | 27.8 | 171 |
| 8 | 46,163 | 7,801 | 188 | 6.8 | 92 | 1,969 | 18.4 | 129 |
| 9 | 61,724 | 8,444 | 227 | 7.0 | 89 | 1,797 | 14.3 | 113 |
Wall time and per-slot decode behave as they did in Set 1 — the same peak at 6 slots, the same cliff at 8. Obviously memory and GPU% remained the same. Per-slot tok/s followed the same pattern.
The chart below shows prefill rate and aggregate output throughput as parallel slots increase. Note the two axes — the rates are 40× apart. Prefill peaks at one slot and falls with every addition; output throughput climbs to a peak at six. Dashed from eight, where VRAM is exceeded.
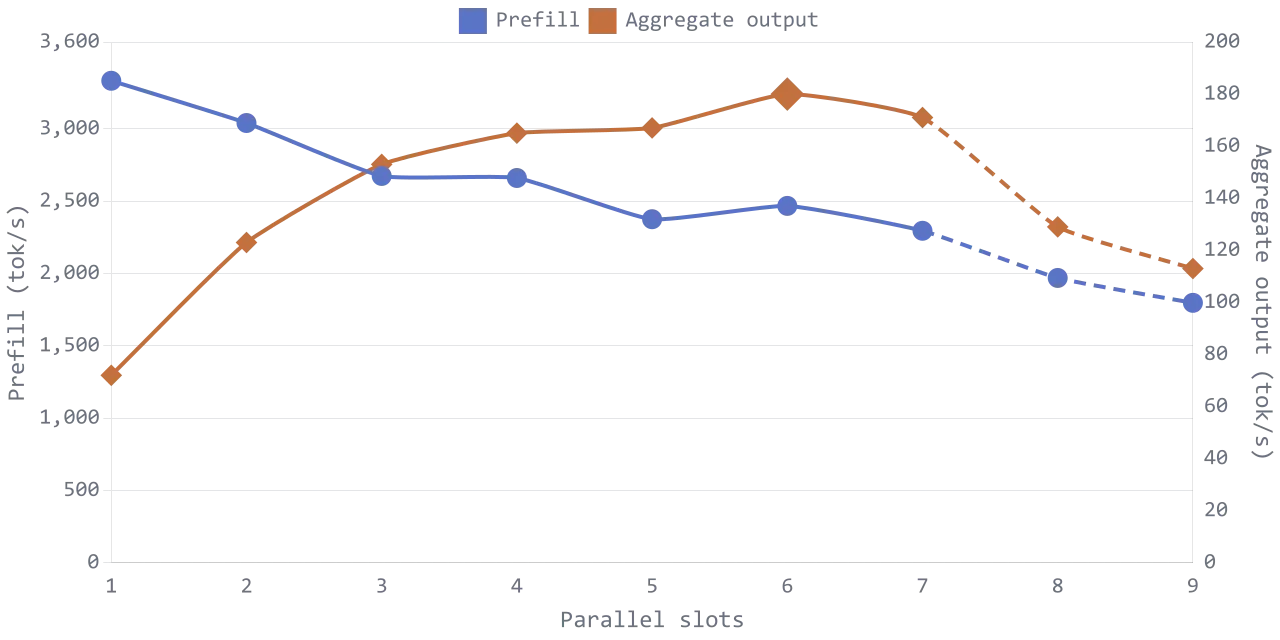
The practical consequence is that the right slot count depends on the shape of your workload rather than the size of your card. Long-prompt, short-output workloads sit more heavily on the prefill side, where the benefit from concurrency is much weaker — and in these measurements, prefill throughput fell with every additional slot.
The conclusion
Three questions were asked.
Firstly, what is the maximum number of parallel requests my card can handle (for this particular model)?
The answer there was calculated before I started as it was based on arithmetic. 224 MiB VRAM overhead per slot meant 7 was the most I could run while keeping the model entirely in VRAM
Second, what is the optimum number of slots to use?
This is what required the tests to find out. Both tests agreed that for this particular shape of request, 6 slots gave the highest throughput. 7 saw a small decline and 8 and 9 had a large drop off due to overflow into CPU.
Per-slot decode gets slower with each slot, but aggregate climbs. The pre-fill heavy 2nd test had lower overall throughput as prefill has no benefits from concurrency.
Third question, do we get diminishing returns. The answer is yes. Not due to I/O, network or database contention like you might see on an API. Decoding reads the whole model from VRAM for every token, and concurrent sequences share that read, so it scales; prefill uses the GPUs compute so concurrent prefills slow each other down.
And both tests saw a small drop-off in aggregate throughput BEFORE reaching the ceiling of the card’s memory.
The peak is below the ceiling, and where it falls depends on your workload, so the arithmetic gets you an upper bound but only measurement gets you a number.
Source Code available at: https://github.com/spenceclark/parallel-llm.
Footnote
My first plan was to use the qwen3.5:4b model for these tests. However on my first attempt at parallelised work, I noticed it wasn’t actually running tasks in parallel.
The clue to what was happening was in the Ollama log files:
level=WARN source=sched.go:510 msg="model architecture does not
currently support parallel requests" architecture=qwen35

... (later)

n_seq_max = 1, n_slots = 1
After some investigation, it appears this is because Qwen3.5 is what is classed as a hybrid-model, a newer architecture which is not something currently supported llama.cpp, which Ollama uses under the hood.
So for now, if a hybrid model is used - it is limited to one slot only.