
In Models & Monsters I put a Dungeon Master, a rulebook resolver and a room full of heroes and monsters together, with every role played by its own agent, all running on an 8 GB GPU inside an 8k context window. The goblins were the fun part. Keeping the thing working came down to knowing exactly what each model had been sent.
To chase context overflows and work out what each character’s context was missing or carrying too much of, the harness logged every request and response to JSONL files, along with every decision and dice roll the engine made. As I said in that post, chasing down each model’s foibles would have been difficult without it.
That logging had limits, though. It lived inside the harness, behind my own abstraction over Ollama, OpenAI, Anthropic and OpenRouter, and logging inside your own code only records what the code believes it is sending. The SDK underneath still adds its defaults, builds the URL and reshapes errors on the way back. And the next project would need the same logging written all over again.
So for the next thing I built, I moved the logging out of the code and onto the wire.
That’s Vessel. It is a reverse proxy that sits between LLM clients and whatever serves the model. It forwards the traffic untouched, records every request and response to a local SQLite file, and serves a web UI for browsing, searching, replaying and comparing them. It works in front of my own code and in front of tools I didn’t write, like Open WebUI, aider or Cline, without changing either. It’s a single binary under the MIT licence, and the captured traffic stays on your machine.
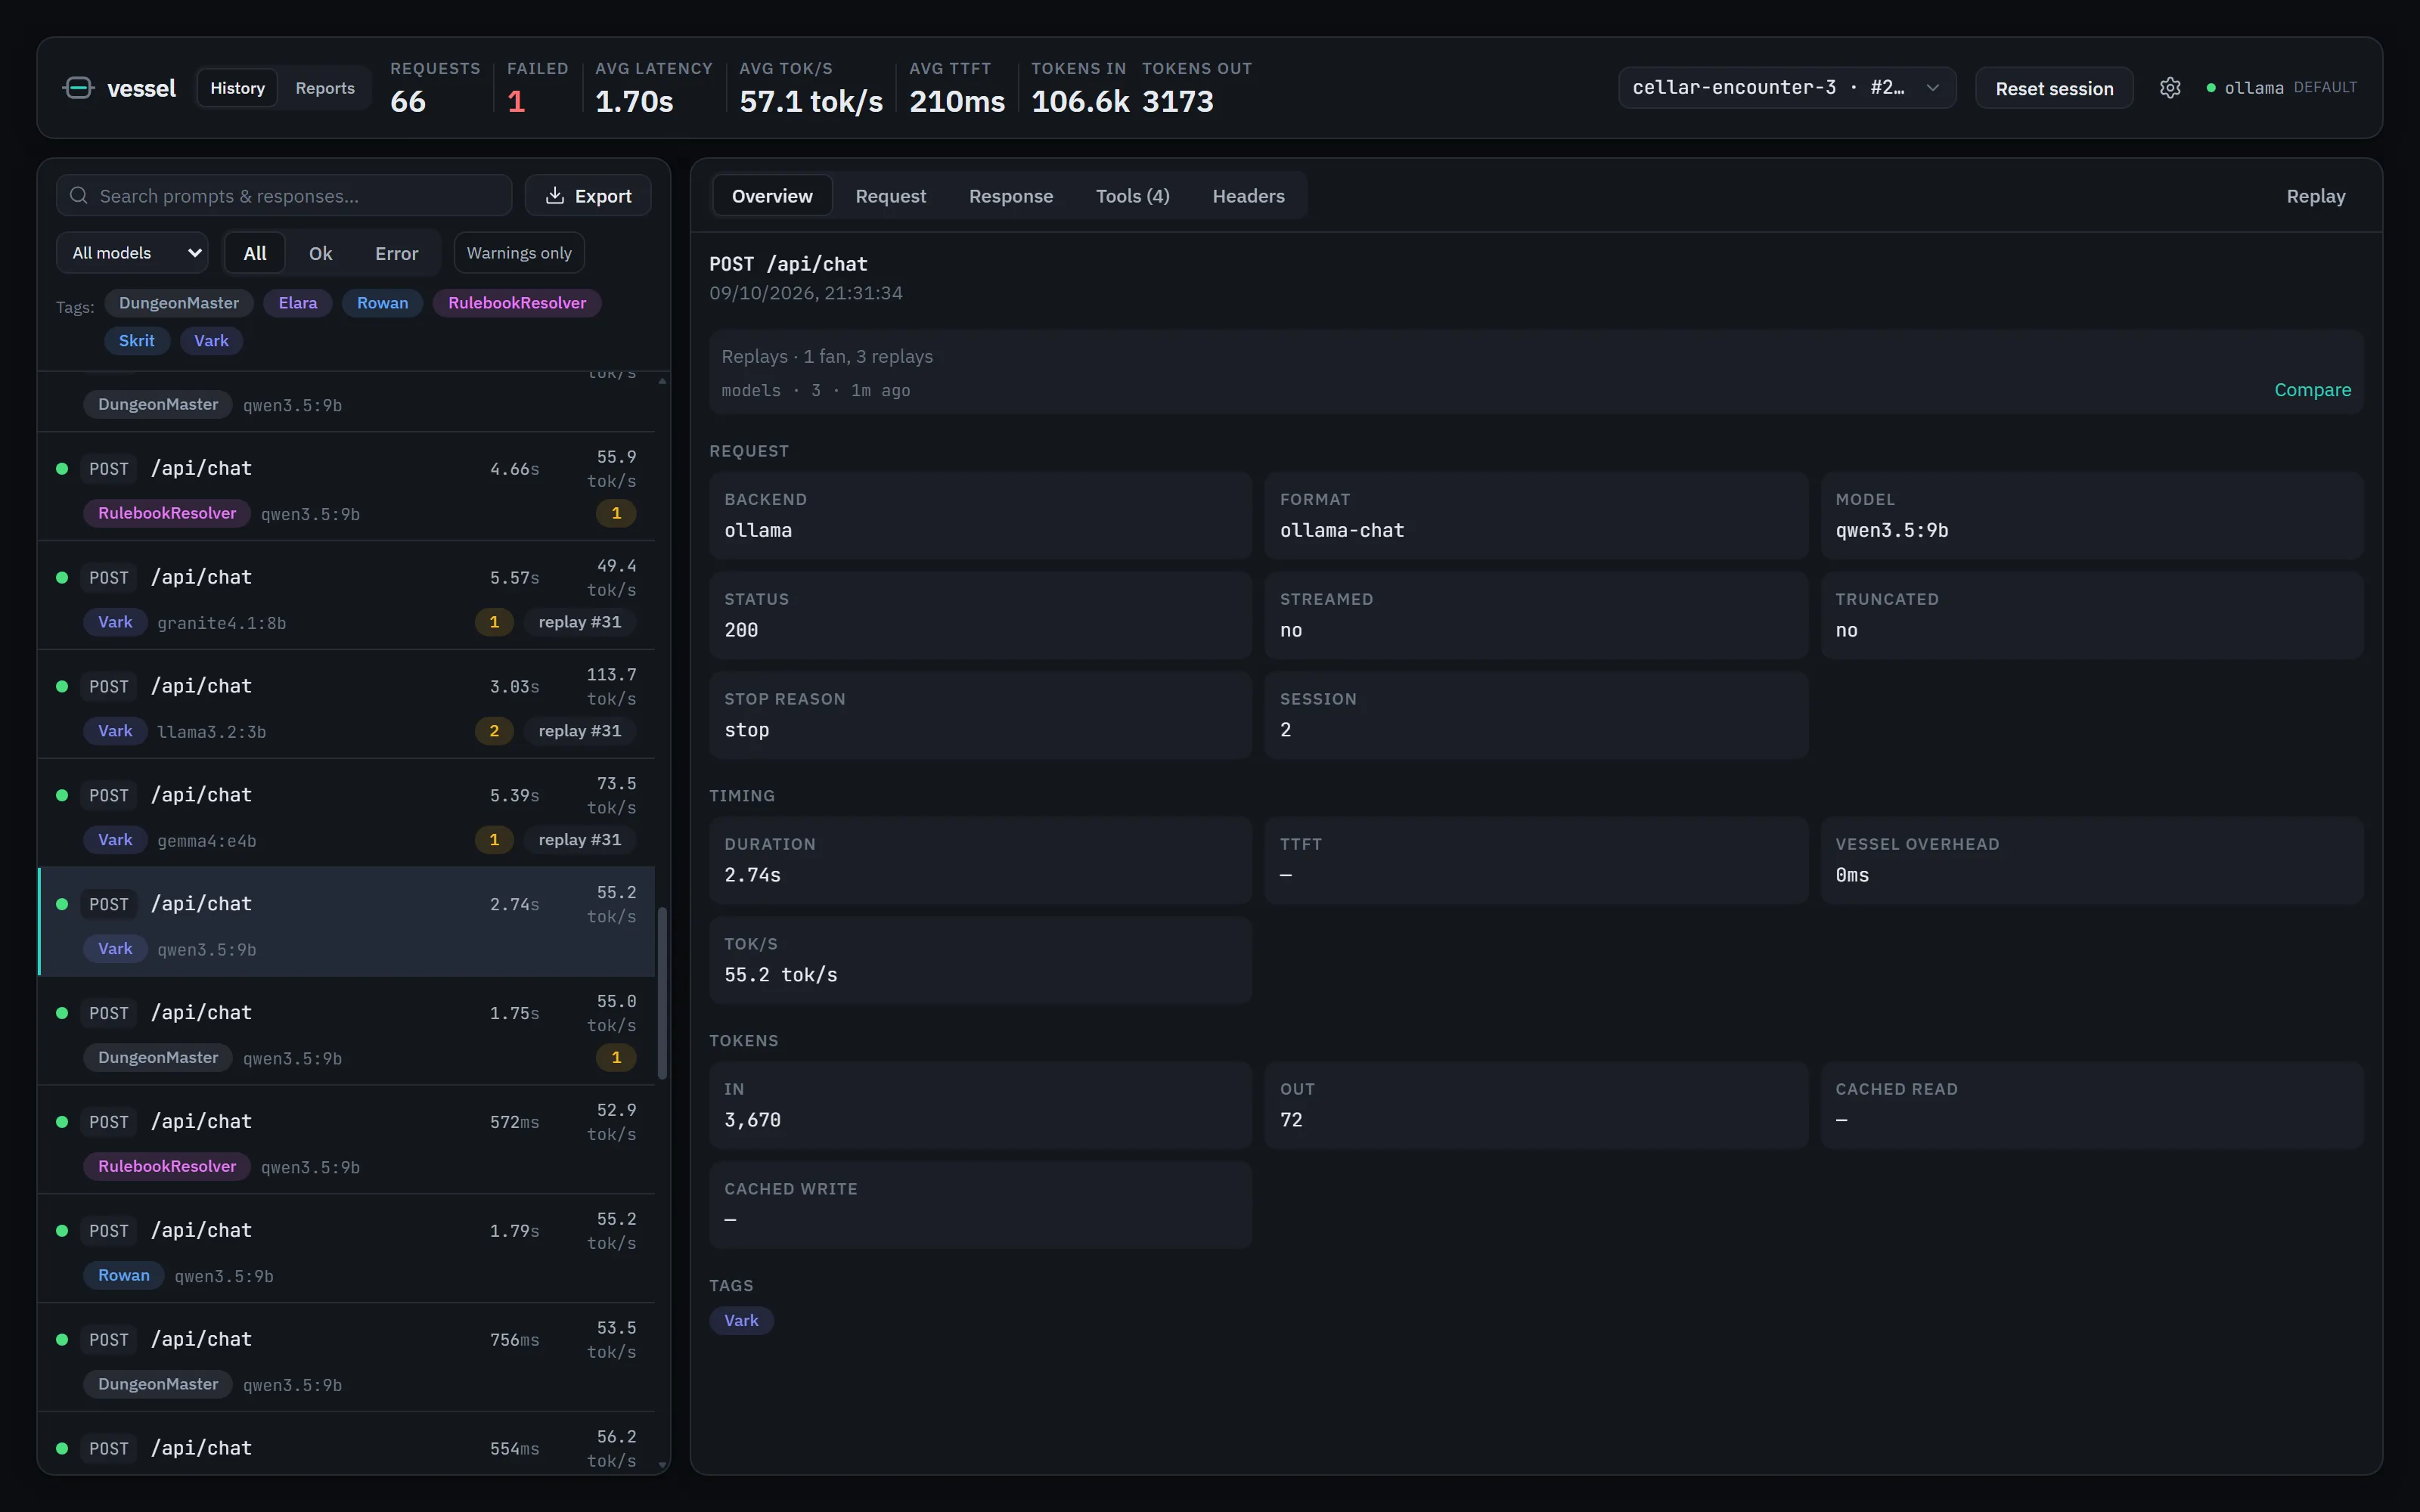 A Models & Monsters encounter in Vessel. Each character is a tag, and the selected row is Vark’s round-three turn, with its replay fan linked from the Overview.
Getting it running
On Windows it’s winget install spenceclark.Vessel. There’s a Homebrew tap for macOS and Linux, a Scoop bucket, a container image on GHCR, or you can grab an archive from the releases page. Run it and it creates a config, listens on 127.0.0.1:4550, and opens the UI in your browser.
Out of the box the default backend is Ollama on localhost:11434, so anything that already talks to Ollama only needs the address changing:
OLLAMA_HOST=127.0.0.1:4550 ollama run llama3.2That’s only a default, though. If you only ever use OpenAI, make it the default backend (one click in the config panel, or defaultBackend in vessel.json) and point your clients at http://127.0.0.1:4550/v1 with no path prefix or header to think about. If nothing is listening on the Ollama port the first time Vessel runs, it opens straight on the backend picker instead.
When you use more than one backend, the others are a path prefix away:
from openai import OpenAI
from anthropic import Anthropic

openai_client = OpenAI(base_url="http://127.0.0.1:4550/b/openai/v1")
claude_client = Anthropic(base_url="http://127.0.0.1:4550/b/anthropic")
/b/{name} selects a backend from the config and is stripped before the request is forwarded. If you’d rather keep the URL clean there’s an X-Vessel-Backend header instead.
Tags work the same way, either /t/DungeonMaster/... or X-Vessel-Tags: DungeonMaster, and they’re how each Models & Monsters character shows up as its own agent in the UI. X-Vessel-Session: run-42 groups requests into a named run with its own stats, so one encounter is one session and each character is a tag within it. Anything starting with X-Vessel- is removed before the request leaves, so the backend never sees any of it.
How it works
Why a reverse proxy
The first real decision was which kind of proxy to build. A forward proxy like mitmproxy can see everything without touching the client, but you have to install and trust a certificate, and plenty of runtimes ignore the system proxy settings anyway. Every LLM SDK I’ve used lets you override the base URL, so a reverse proxy gets the same visibility from one config change and needs no certificates. Clients talk plain HTTP to localhost. Vessel makes its own ordinary HTTPS connections out to OpenAI or Anthropic.
The other rule from the start was that Vessel never changes the traffic. The backend receives exactly what the client sent, minus the X-Vessel-* headers. The one exception is opt-in. OpenAI-format streams don’t report token usage unless the request asks for it, so a backend can be set to injectStreamUsage, which adds stream_options.include_usage to streamed requests. It’s off by default, and every row it touched is marked. Without it, Vessel estimates at about four characters per token and shows those counts with a ~ in front.
The stack
It’s .NET 10, with YARP running on Kestrel. The usual question is why I didn’t use Go or Rust. Mostly because .NET is what I know best, and YARP already handles streaming reverse proxying properly, so I didn’t have to write a proxy from scratch. A self-contained single-file publish means there’s no runtime to install. The React UI is built during dotnet publish and embedded in the binary as resources, and the SQLite native library rides inside the executable too. You download one file and run it.
Under the hood I kept the request path as short as I could. Each response chunk is written to the client first and only then copied into a capture buffer, so capture can never hold a byte back. When the response finishes, the record goes onto a channel and the request is done. A single background writer picks it up, folds streamed SSE or NDJSON back into a final message, pulls out the model, token counts, stop reason and tool calls, and batches it into SQLite (WAL mode, FTS5 for search, bodies zstd-compressed). Anything it can’t parse is still stored as raw bytes with timings. Vessel also times its own share of every request and shows it on the row, which on a warm process has measured 0.09 to 0.41 ms. For Ollama the token counts come straight from its own prompt_eval_count and eval_count, which is the number that gave away the dropped document in What the model actually saw.
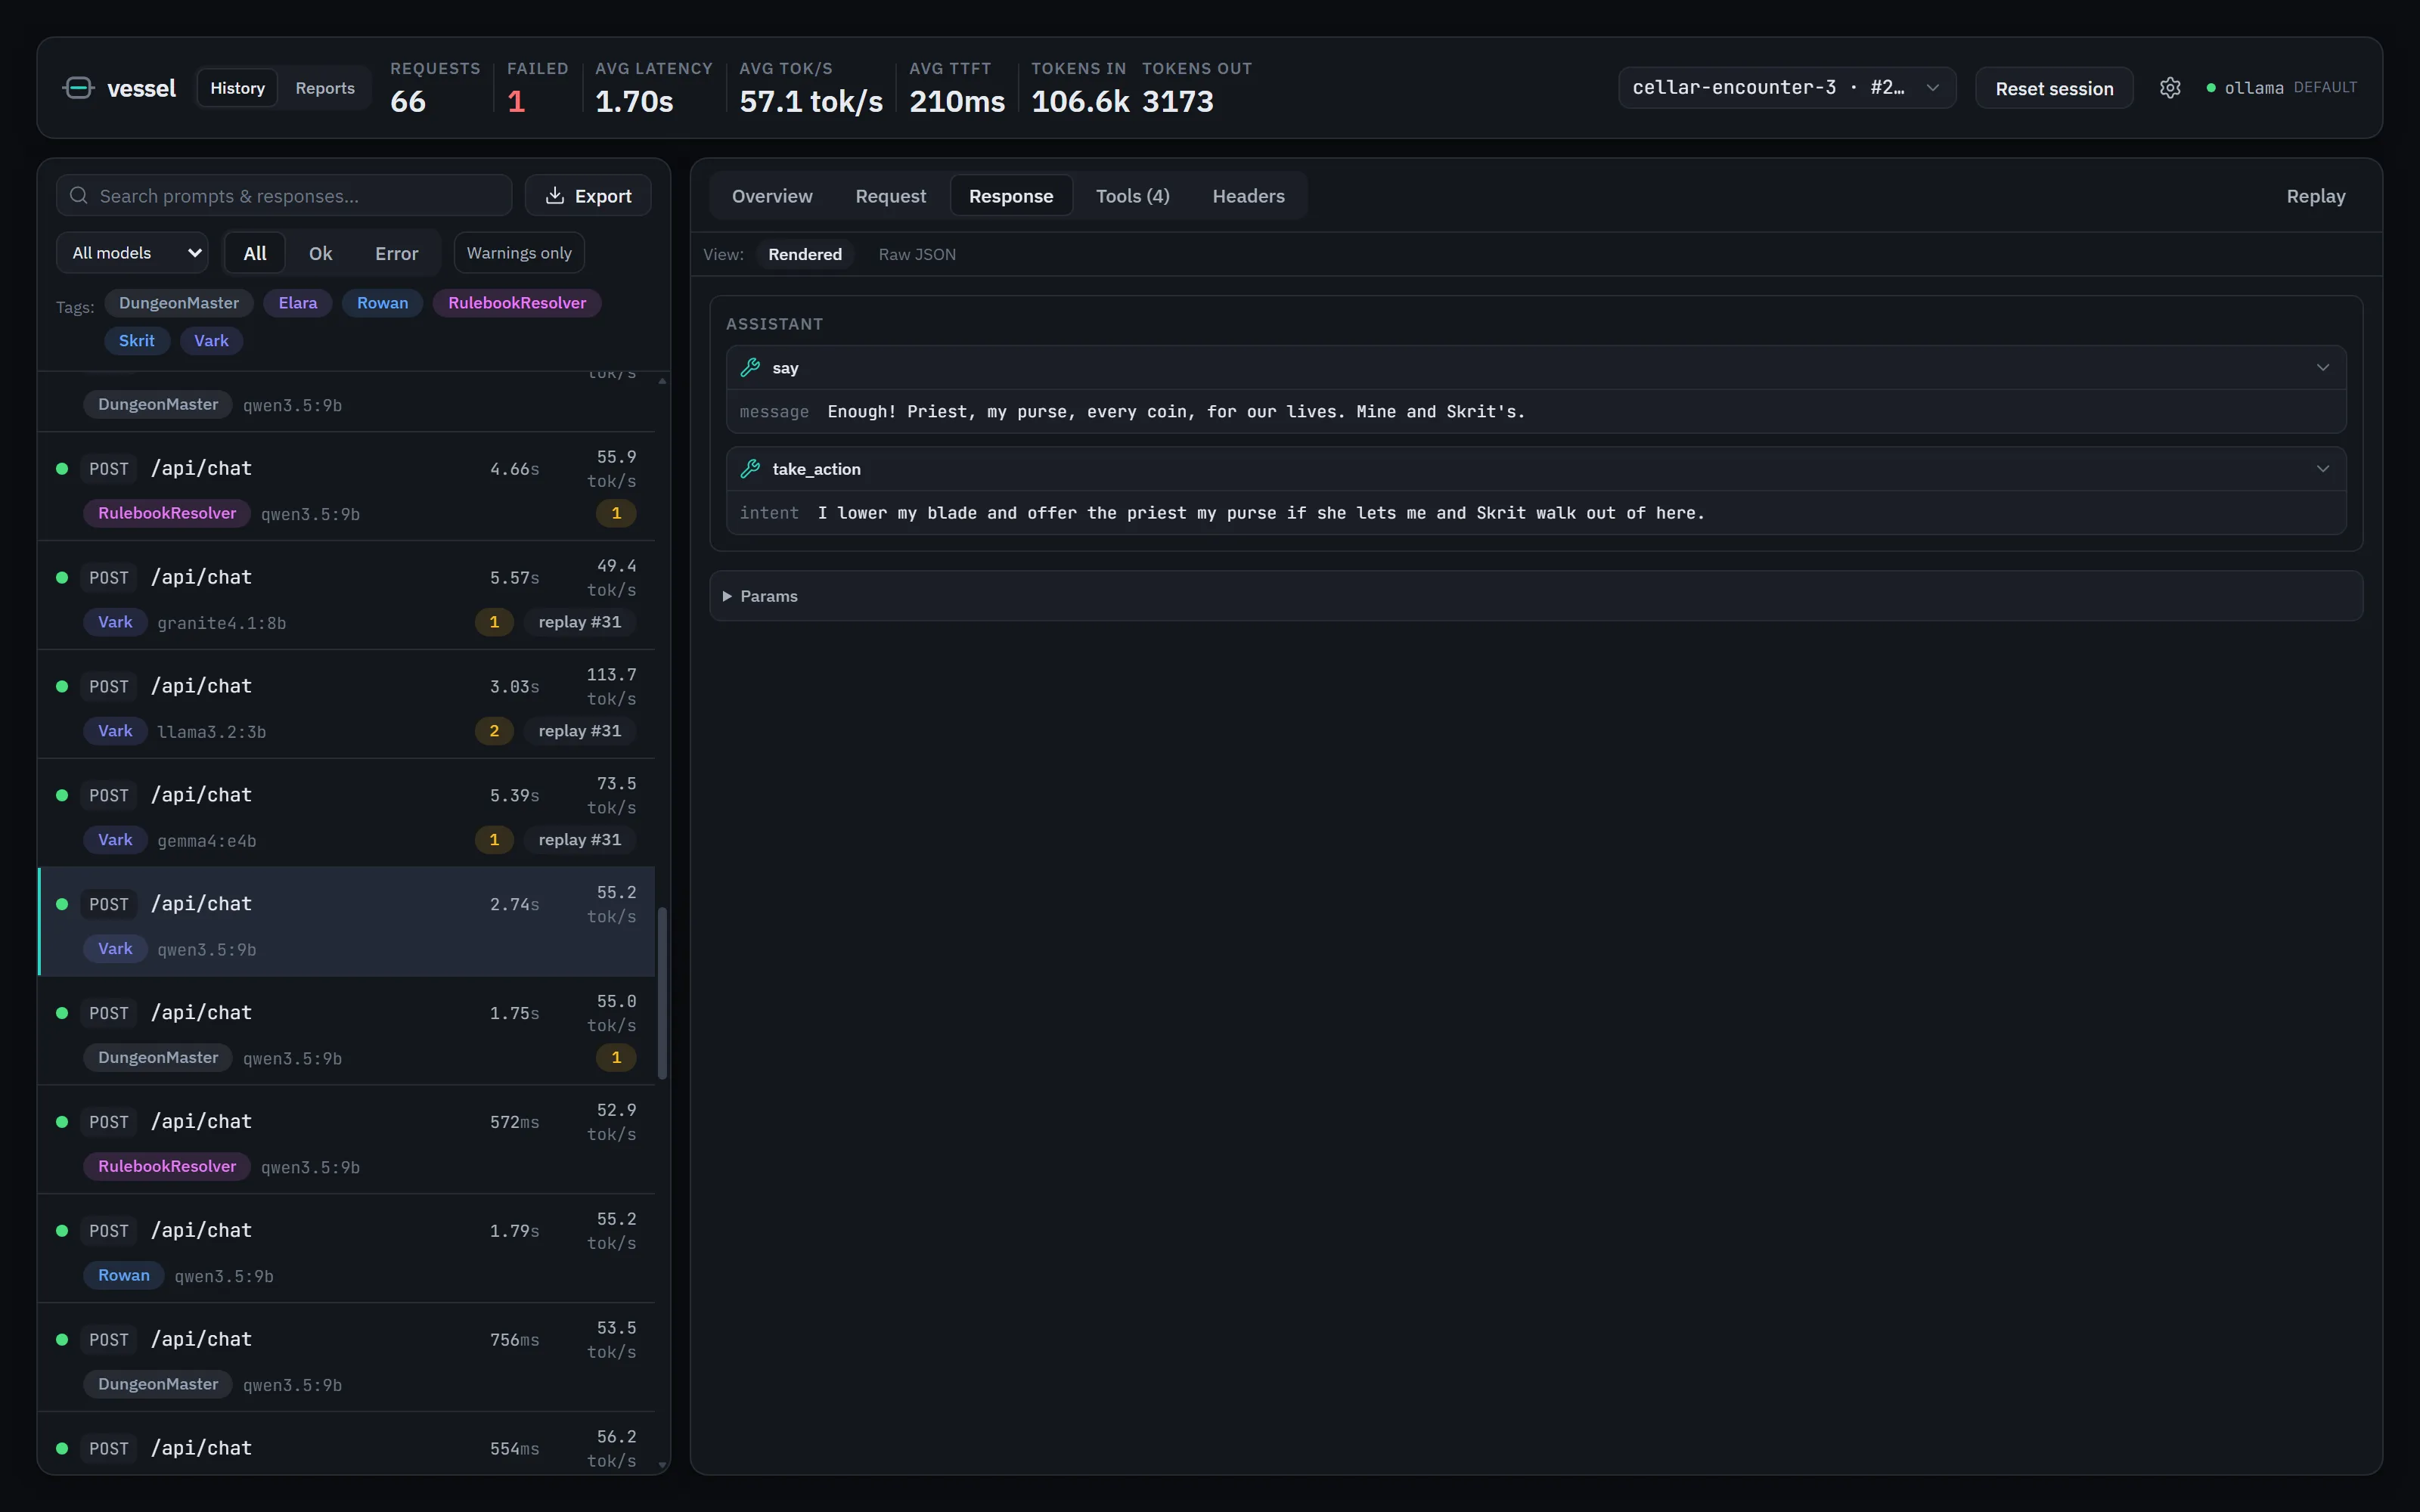 The same request’s Response tab. Vark’s reply, folded back from the wire into
say and take_action tool-call cards.
Warnings
Each row gets warning badges. Most are what you’d expect: truncated by max_tokens, HTTP errors, client disconnects, slow time to first token. cold_load marks a request where Ollama spent the time loading the model into memory, which turned out to explain about half of my “why was that slow” questions. The more interesting ones came out of real runs.
During a research-agent run last month, a summariser call to a 2B MiniCPM quant ran for nearly ten minutes and came back with 42,622 tokens of 1/1/1/1/.... The stop reason was a perfectly normal stop. Four other summarisers had started in the same millisecond and queued behind it, because my Ollama only runs one request at a time. One of them took 592 seconds to produce 301 tokens, and the client gave up on two more at the ten-minute mark. The agent then seems to have fallen back to stuffing raw page content into its final request, which jumped to 49,657 input tokens.
Vessel had captured every step of that and flagged none of it. That’s how it gained repetitive_output, for a response that ends in a loop, and slow_response, for a non-streamed request that runs past a configurable threshold.
tool_call_in_text covers the case where a request declared tools and the model wrote the call out as JSON in its reply instead of making a structured call. Smaller local models are prone to it. Vessel only flags it and never rewrites anything.
The live view
The UI shows requests while they’re still running. An SSE feed publishes lifecycle events (started, request_ready once the model name has been parsed out of the request, first_token, completed), and in-flight rows tick along with a running timer.
This bit took more iterations than anything else. Each browser tab gets a bounded buffer of 256 events that drops the oldest when full, so a stalled tab can never slow down the proxy. Every event carries a monotonic id, so the client can tell when it missed one. On a gap or a reconnect it fetches a snapshot of what’s in flight together with the event position that snapshot is valid at, throws away everything it’s holding at or before that position, and applies newer events on top. A per-process run id tells it whether the server restarted or the connection just blipped.
I got there by failing twice. Both earlier attempts tried to send the client a description of what a “clear history” had deleted and let it work out which rows to drop. That fell apart once SQLite started reusing row ids after a clear, or the client simply missed the event. A snapshot plus an ordered log turned out to be the only version I could reason about. The UI also applies events in batches every ~100 ms, because updating React state per event stalled the main thread under bursts of 10,000 requests.
Keys and localhost
Vessel binds to localhost by default. Auth headers (Authorization, x-api-key and friends) are stored as the scheme plus the last four characters, enough to recognise which key was used and useless if the database leaks. The redaction happens before the record goes onto the channel, so a plaintext key never reaches the writer or the database. Vessel never stores keys at all. When it needs one for a replay, it reads it from an environment variable on the Vessel process, OPENAI_API_KEY, ANTHROPIC_API_KEY, or whatever name you’ve configured for that backend.
Binding to localhost isn’t enough by itself. Any web page open in your browser can send requests to 127.0.0.1, and DNS rebinding can point an attacker’s hostname at it too. Everything under /vessel/ therefore checks that the Host header is a loopback name or the configured listen address, and any API call that changes something has to be same-origin. Requests carrying neither Origin nor Sec-Fetch-Site (curl, scripts, SDKs) aren’t coming from a browser and are let through. None of this applies to proxied routes, so it can’t break ordinary SDK traffic.
The prompts themselves are stored in full, since that’s the whole point. The README says plainly that vessel.db contains your prompts.
Replay and Compare
Models & Monsters ran the same scenario across a long list of models, from Qwen3.5 9B on my own GPU up to the hosted frontier models, and comparing them meant running whole encounters again. Vessel does the same thing for a single request.
Pick any captured request and replay it against the same backend, a different one, or a different model. The replay goes through Vessel’s own /b/{backend}/ route, so it gets captured, parsed and linked to the original like any other request. Compare then puts the responses side by side with metric deltas and a diff of the parameters.
A replay can fan out to up to eight variations, either several models or one parameter swept across values (temperature at 0.2, 0.7 and 1.0, say). Each variation is a JSON merge patch (RFC 7396) applied to the stored request body. That keeps replay ignorant of where a given format keeps its sampler settings, whether at the top level or under Ollama’s options. Members of a fan run one after another. My first version fired them all at once, and since they all landed on the same local GPU, the duration column ended up measuring contention instead of the models. Before anything goes out, the dialog tells you how many requests it’ll send and how many of those go to paid APIs.
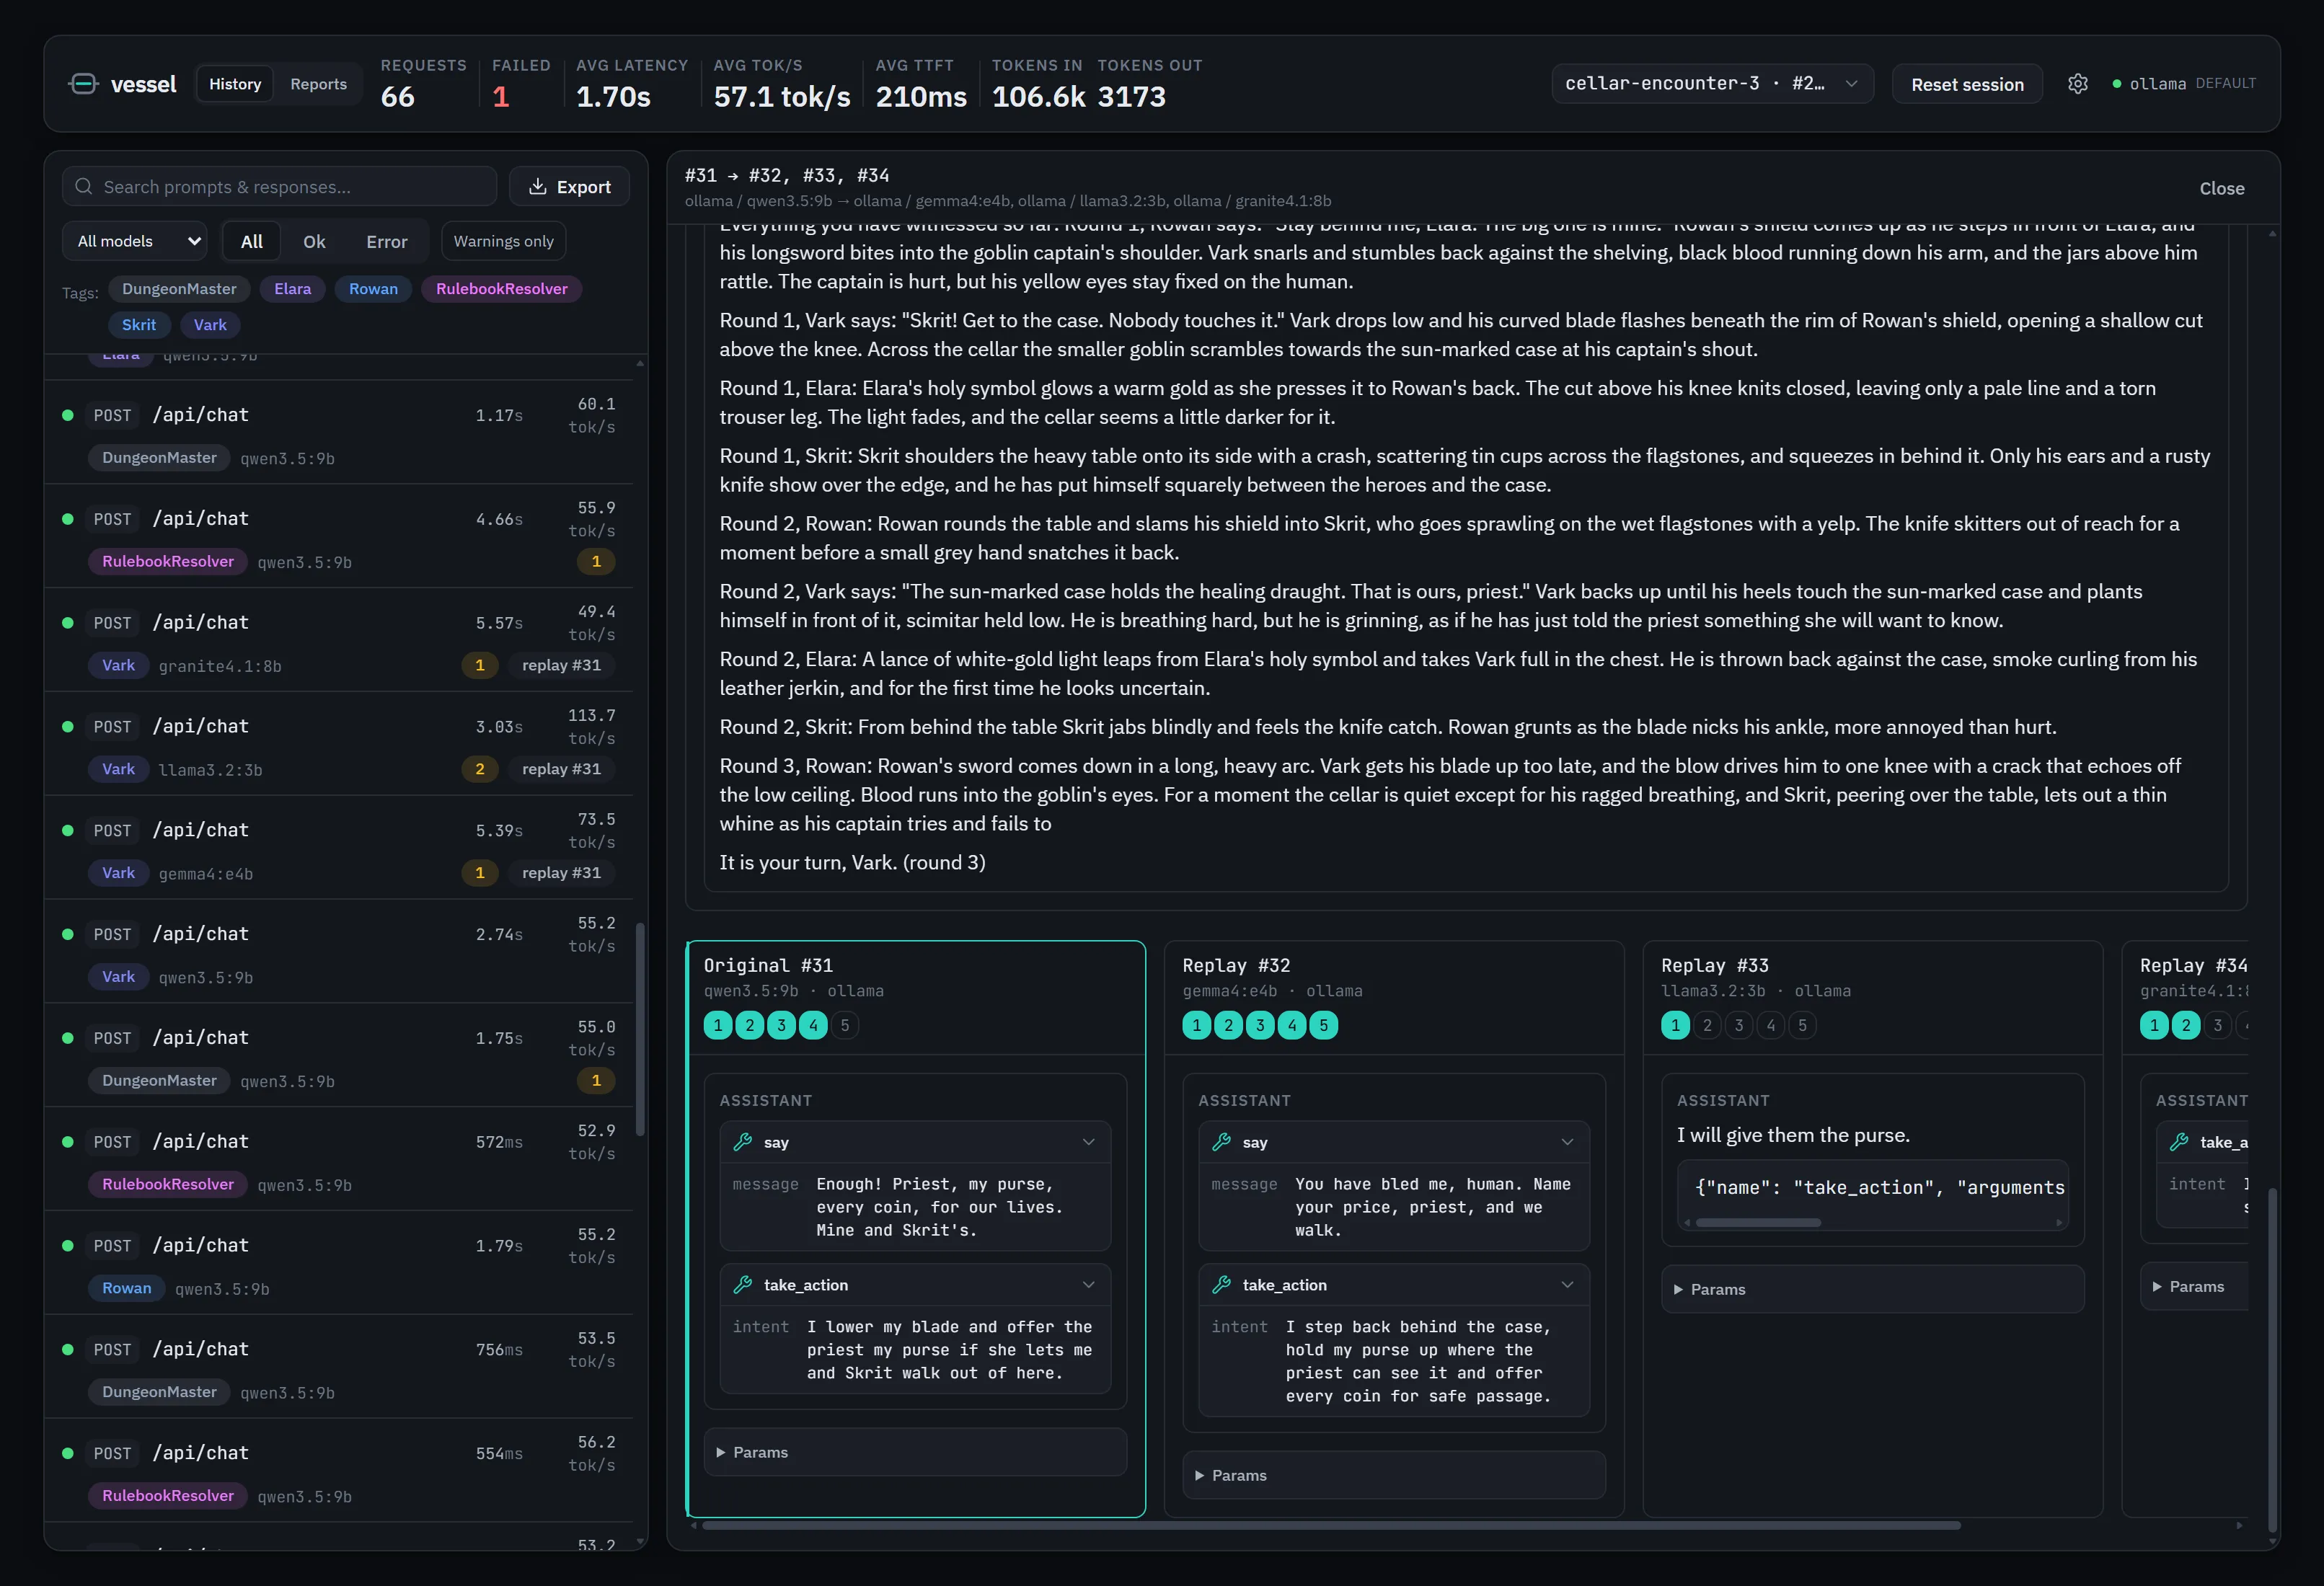 Vark’s offer replayed on three more models. llama3.2:3b wrote its tool call as JSON in the text, which is what
tool_call_in_text flags.
You can score each response from 1 to 5 with the number keys, and the Reports view ranks models and parameter sets by average score and how often each came out on top. This is the part that stuck for me. I took a real prompt from one of my agents, replayed it on a 2.6B model and on gemma4:e4b, and read the two answers side by side. It settled an argument I’d been having with myself in about a minute.
If you’d rather not be the judge, the MCP endpoint (more on that below) covers it. Search results carry each request’s replay group and score, so you can ask Claude Code, or any MCP client, to pull every response in a fan and grade them against a rubric of your own. I kept a built-in judge out of Vessel on purpose, because rubrics and judge models are where an observer starts turning into an eval harness. The endpoint is read-only, so the judge’s verdicts stay in that conversation and the 1 to 5 scores in Vessel remain yours.
Reports also has a context-growth chart, plotting input tokens per request across a session with one line per tag. That’s the Models & Monsters problem in one picture: which character’s context is creeping towards the 8k ceiling, and how fast.
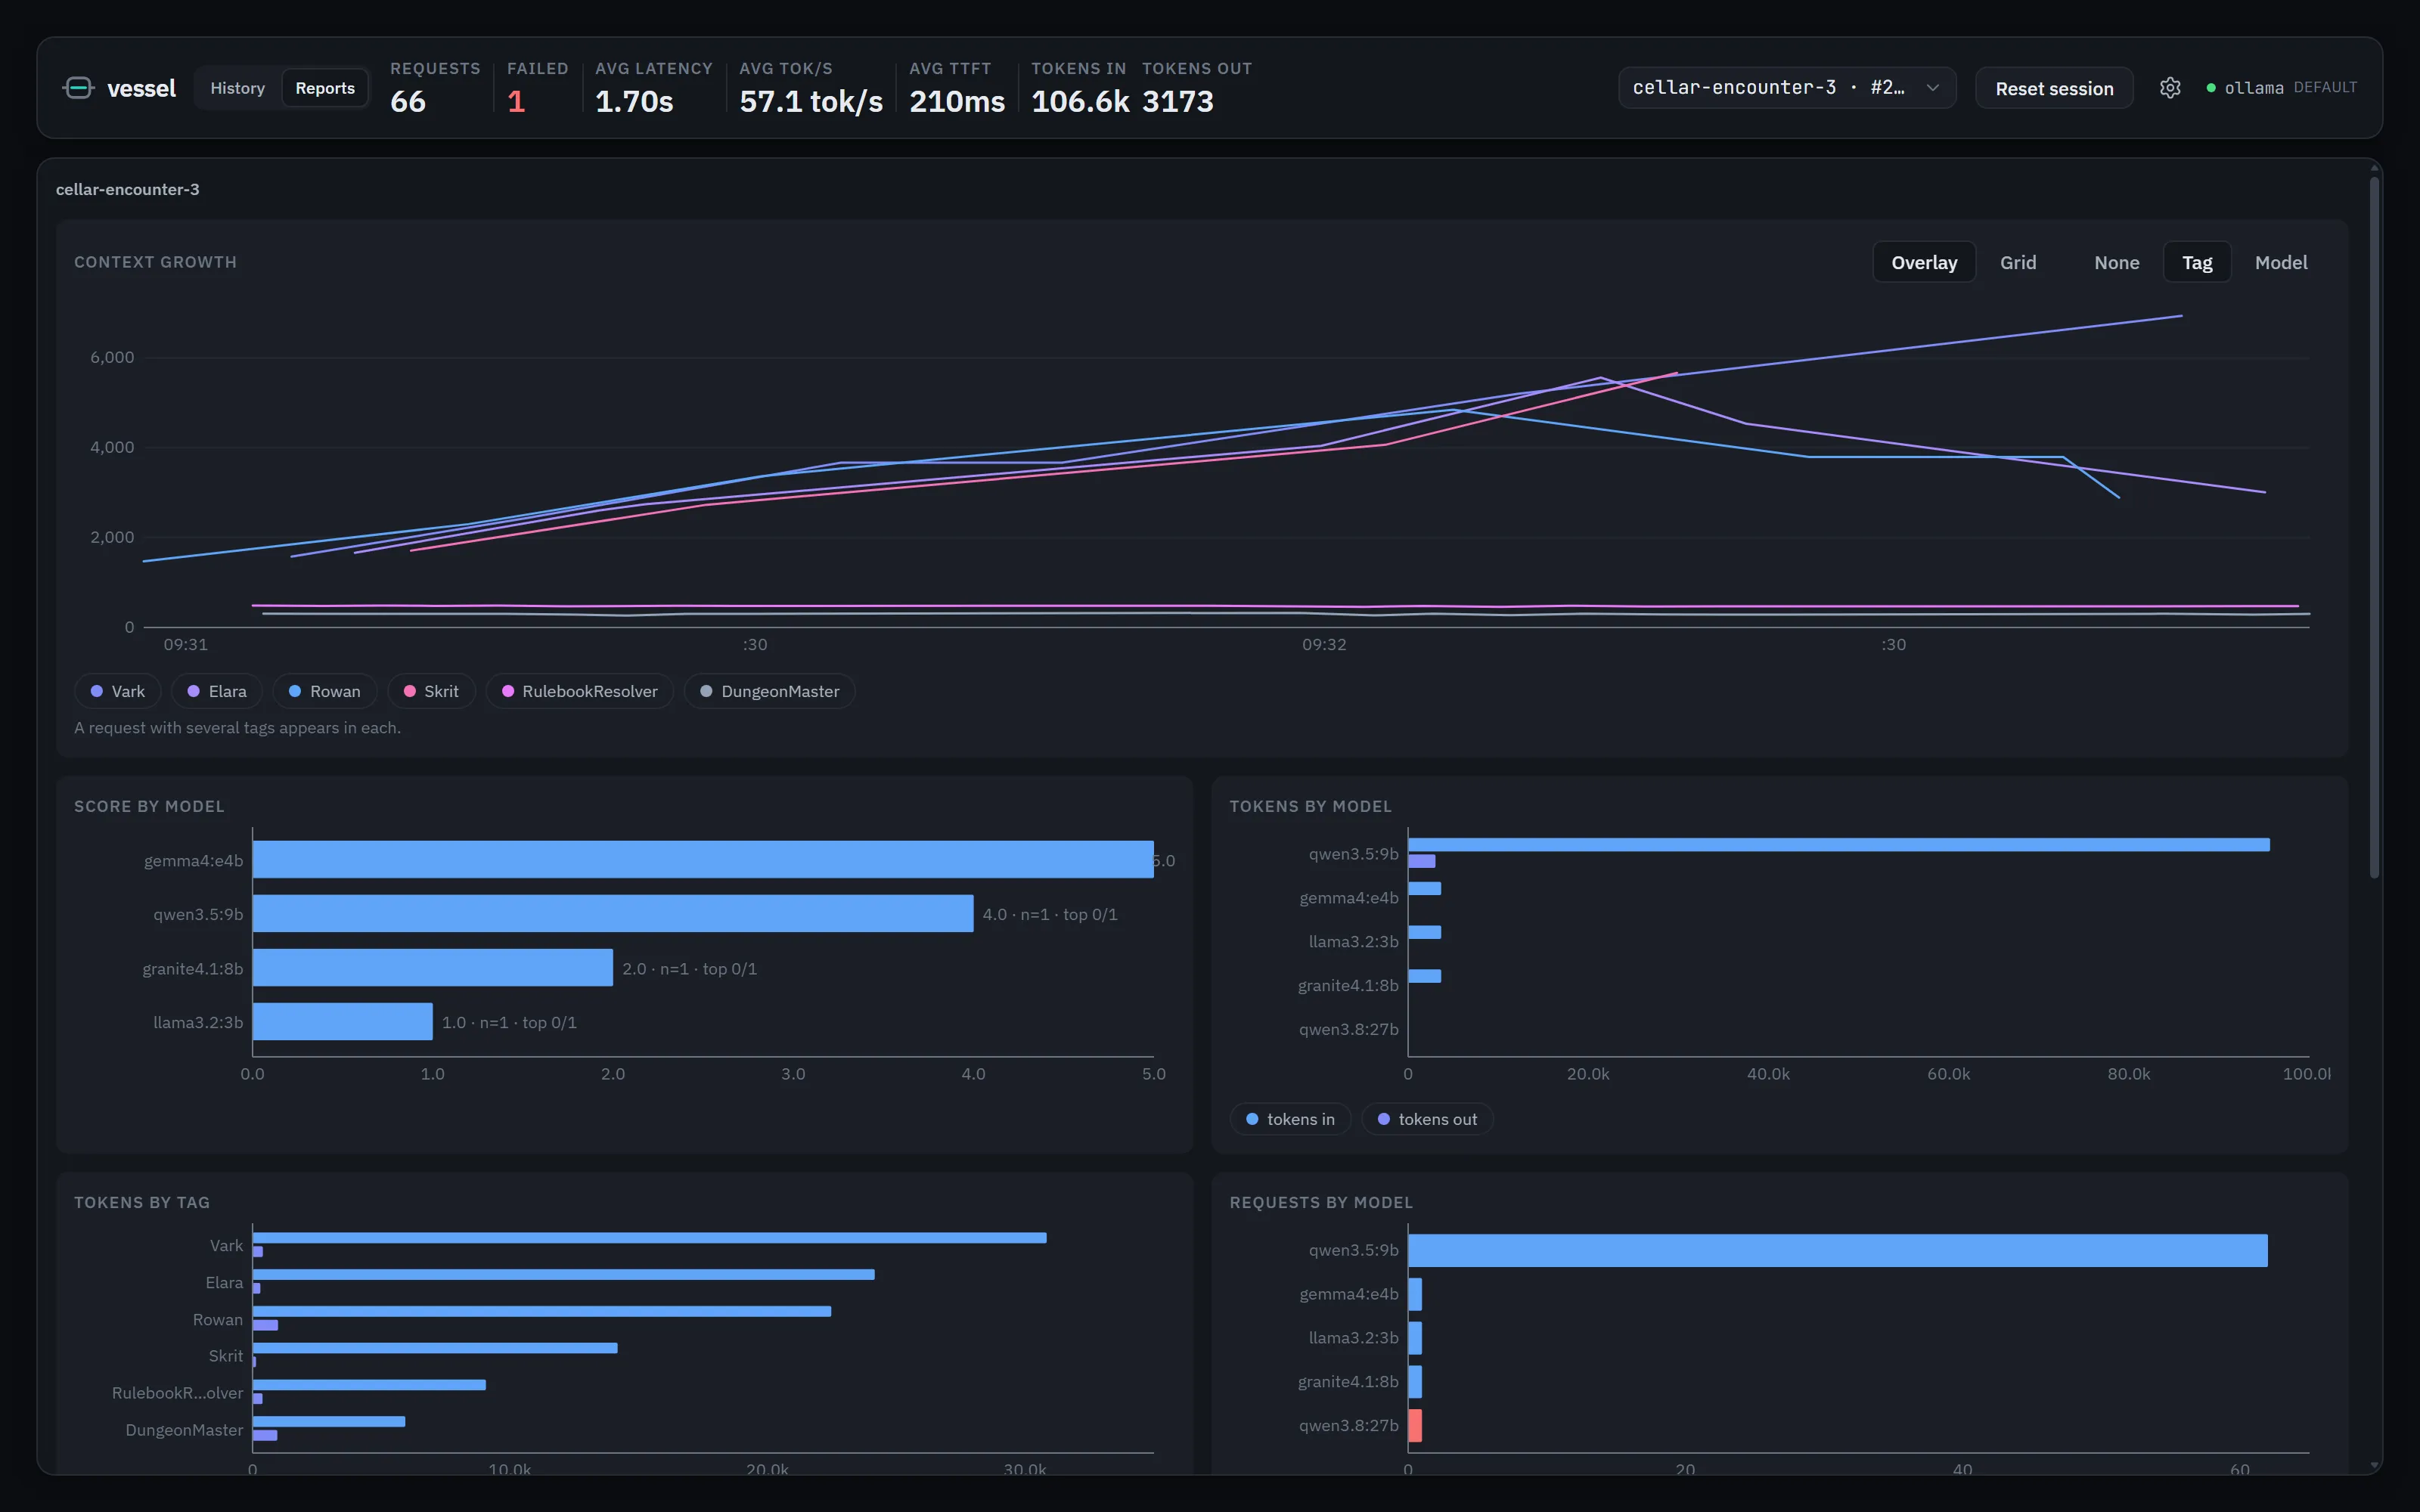 Context growth by tag for one encounter. Vark climbs towards the ceiling while Elara and Rowan drop after compaction; the score leaderboard sits underneath.
Replay stays within one wire format for now: an Ollama-native request can’t be replayed against Anthropic. The one translation it does handle is max_tokens versus max_completion_tokens for OpenAI chat, which would otherwise make a lot of cross-backend replays fail. It’s renamed automatically and shown as (auto) in the parameter diff.
Jev and System One decisions
The newest format Vessel understands isn’t chat at all. TypeSafe’s System One API, which launched with their Jev models in September, takes a state and a set of typed questions, and returns an answer to each with probabilities and a confidence. A question can be yes/no, a choice between named options, or a score on an ordered scale:
{
  "model": "jev-latest",
  "state": { "ticket": "The export button does nothing on Safari." },
  "questions": {
    "is_bug": { "type": "noul", "instructions": "Is this a bug report?" },
    "area": {
      "type": "choice",
      "instructions": "Which part of the product is affected?",
      "criteria": { "frontend": null, "api": null, "billing": null }
    }
  }
}
There are no messages and no streaming, and it made a good test of the raw fallback. The first System One requests through Vessel went via OpenRouter, and they proxied perfectly and landed as raw rows. They were captured and timed, and that was about it. There was no model, no token counts and nothing in search, and the interesting part (which option won, and how confidently) was buried in two JSON blobs.
0.3.0 added a proper adapter. System One traffic is now recognised on TypeSafe’s own /v1/systemone endpoint and on OpenRouter’s /api/alpha/decisions, model and tokens are extracted like any other row, and the detail view renders a card per question with a probability bar for each option.
At the end of September Ollama 0.35 started serving the same API locally, on the same path, with three small decision models: nimble (9B), tev1 (4B) and tev1:0.8b. That made the obvious comparison possible, so 0.3.1 lets System One captures replay across the two. You can fan a Jev request out to nimble and tev1, or check a local decision against Jev. Credentials only ever come from the target backend, so a TypeSafe key never reaches Ollama. In Compare the probability bars line up in the same order in every column, and the metric rows that don’t apply to a decision, like TTFT and tok/s, are hidden.
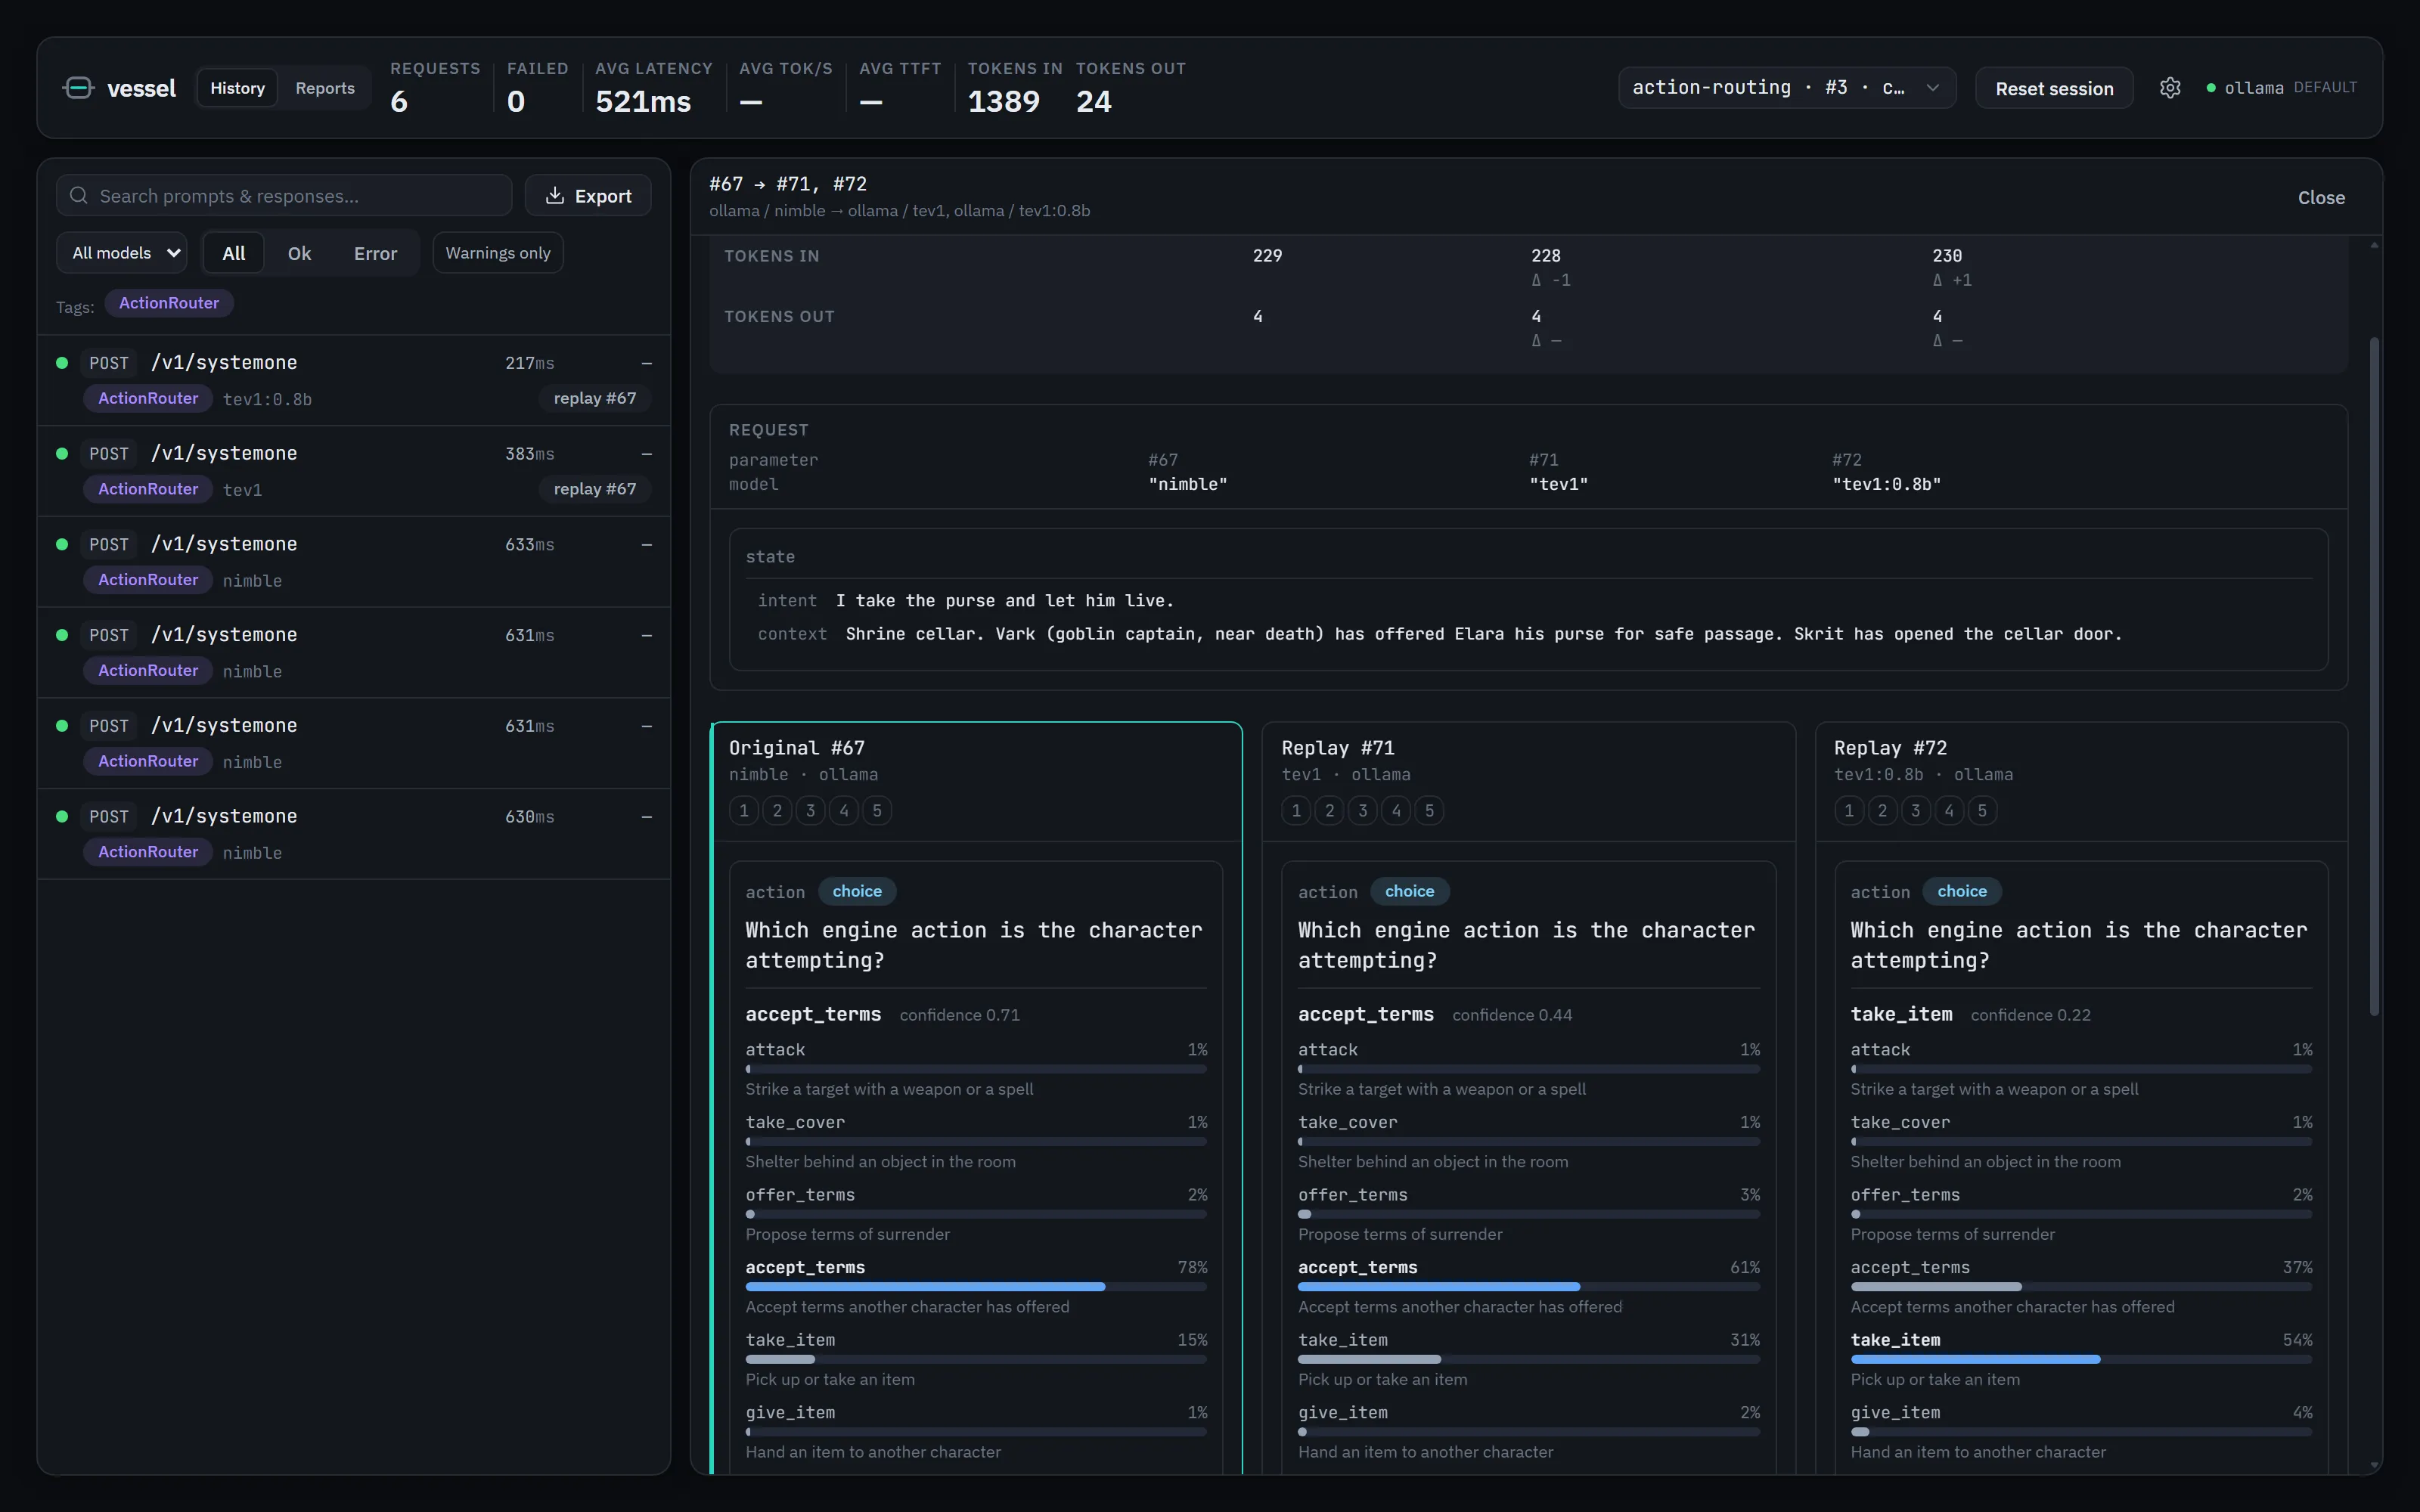 One System One request from the action router, compared across nimble, tev1 and tev1:0.8b.
LangChain, LangGraph and Pydantic AI
A lot of agent code sits on top of a framework, so I wanted tags and sessions to work from the popular ones without patching anything.
LangChain chat models don’t expose per-request headers, but nothing here strictly needs them. Per-agent tags can ride on the path, with one model instance per agent:
planner = init_chat_model('ollama:llama3.2', base_url='http://127.0.0.1:4550/t/planner')For per-run sessions, or node tags from one shared model, a callback can stamp each outgoing request. LangGraph already puts the node name in the run metadata. Put the thread_id in there too and it becomes the Vessel session:
import contextvars, httpx, uuid
from langchain.chat_models import init_chat_model
from langchain_core.callbacks import BaseCallbackHandler

_vessel: contextvars.ContextVar[dict | None] = contextvars.ContextVar('vessel', default=None)

class VesselCallback(BaseCallbackHandler):
    def on_chat_model_start(self, serialized, messages, *, metadata=None, **kwargs):
        md = metadata or {}
        _vessel.set({k: v for k, v in {
            'X-Vessel-Tags': md.get('langgraph_node'),
            'X-Vessel-Session': md.get('thread_id'),
        }.items() if v})

def _stamp(request: httpx.Request):
    request.headers.update(_vessel.get() or {})

llm = init_chat_model('ollama:llama3.2', base_url='http://127.0.0.1:4550',
                      client_kwargs={'event_hooks': {'request': [_stamp]}})

thread_id = str(uuid.uuid4())
graph.invoke(state, config={'configurable': {'thread_id': thread_id},
                            'metadata': {'thread_id': thread_id},
                            'callbacks': [VesselCallback()]})
The callback sees the run metadata, the httpx hook sees the request, and the context variable carries the values between them. There’s a complete four-node LangGraph example in docs/examples/langgraph.py.
Pydantic AI is simpler, because it already sends per-request headers through extra_headers in the model settings:
session_id = str(uuid.uuid4())
model = OpenAIChatModel('llama3.2', provider=OllamaProvider(base_url='http://127.0.0.1:4550/v1'))

planner = Agent(model, model_settings={'extra_headers': {
    'X-Vessel-Session': session_id, 'X-Vessel-Tags': 'planner'}})
One gotcha there: settings merge shallowly (model, then agent, then run(...)), so a later extra_headers replaces an earlier one wholesale. Send the session and the tag together at whichever level you set them. There’s a two-agent example, with one agent delegating to the other, in docs/examples/pydantic_ai_example.py.
LangChain also gave Vessel one of its warnings. When I first hooked it up, it kept telling me a model couldn’t be found. It took three attempts at the same OpenAIModelNotFoundError before I went and looked at the captured request: POST /chat/completions, a 404, and no /v1 anywhere in the path. The OpenAI SDK appends /chat/completions to whatever base_url you hand it, OpenAI-compatible servers serve that path under /v1/, and langchain_openai translated the 404 into “model not found” on its way back up. The fix in my code was one line. The fix in Vessel was a path_missing_v1 warning, so the row now says what actually went wrong.
MCP
Vessel also has a read-only MCP endpoint at /vessel/mcp, so Claude Code or any other MCP client can search your captured traffic:
claude mcp add --transport http --scope user vessel http://127.0.0.1:4550/vessel/mcpThere are four tools (search_requests, get_request, get_stats, list_sessions), and each request and session is also an MCP resource you can @-mention. Most of the design work went into token budgets. One captured request can hold a 200K-token context, and returning that whole thing from a tool call would wreck the calling agent’s own context. search_requests returns compact rows with no bodies. get_request returns a window of text (4,000 characters by default, 20,000 at most) with an offset for paging, and a note inside the payload saying it was cut.
In practice that means asking Claude Code “why did my summariser stall this afternoon?” and watching it search the history itself. Any MCP client you connect can read your prompts, so there’s a single config switch to turn the endpoint off.
What’s next
The first public release went out at the end of August, and it’s on 0.3.1 now. Everything below is tracked as a GitHub issue.
The two I’m most interested in both touch the riskier parts of the code. Live tail (#34) would stream the response into the UI as tokens arrive, which means adding work to the hot path, so the rule there will be to drop UI updates before ever blocking the proxy. Cross-provider replay (#35) would translate between the Ollama, OpenAI and Anthropic formats so an Ollama request can be replayed against Claude. Parameters don’t map one to one (num_predict against max_tokens, for a start), so that one needs care.
Smaller items:
- An Ollama panel showing what
ollama psshows, loaded models and memory use, plus aserver.logviewer (#36) - Cost estimates from a static pricing table you can override in the config (#27)
- An AUR package to go with Homebrew, Scoop and winget (#50)
- A tray app (#37), if people want one; for now Vessel runs in the foreground and your OS’s usual service tooling covers always-on use
If you run local models or agents and give it a go, I’d like to know what’s missing for your setup. The code is at github.com/spenceclark/Vessel and the landing page is vesselproxy.app.