Part 2 of 2. Part 1 covered what Claude Code, Codex and Qwen Code send over OpenTelemetry.
Part 1 ended with three agents, one standard and three dialects:
- Claude Code sends tidy product analytics in its own attribute names.
- Codex sends thousands of internal spans, with its token counts on the wrong span.
- Qwen Code follows the GenAI semantic conventions, and logs your prompts by default.
Here I send that same data to backends and look at what comes out the other side.
Two things decide what you see. The first is attribute names, because a backend can only build an LLM view from names it recognises. The second is signals. Some backends accept only traces, and a lot of what these agents say goes into logs and metrics. And for Claude Code and Codex, most of these vendors’ own recommended integrations skip OpenTelemetry entirely.
The local baseline: Jaeger’s GenAI tab
Part 1 used Jaeger (2.22) as a neutral trace viewer. It also has a GenAI tab in each span’s detail panel, plus icons that mark LLM, tool and HTTP spans in the span list. It’s the simplest test of “does this backend understand GenAI attributes?”, and the three agents get very different results.
Qwen Code fills it completely: operation chat, provider, model, and input, output
and cached tokens. Tool spans get a tool icon and a “Tool Call: read_file” label.
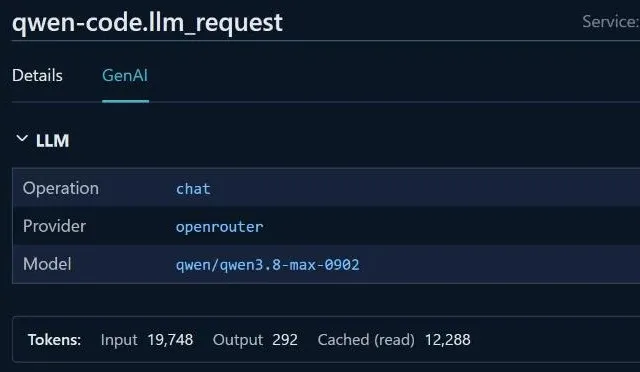
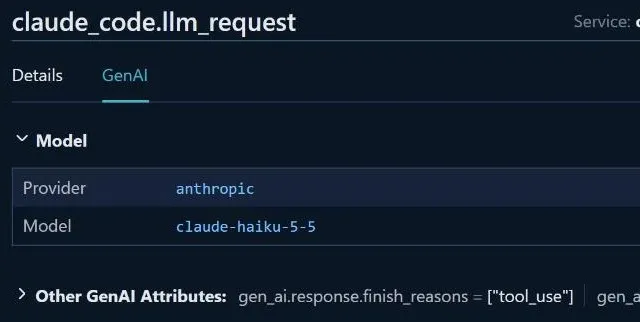
Claude Code gets provider and model only. Jaeger reads the provider from Claude’s
deprecated gen_ai.system attribute. There are no tokens, because Claude calls them
input_tokens, not gen_ai.usage.input_tokens, and there’s no operation name. Its tool
spans aren’t recognised at all.
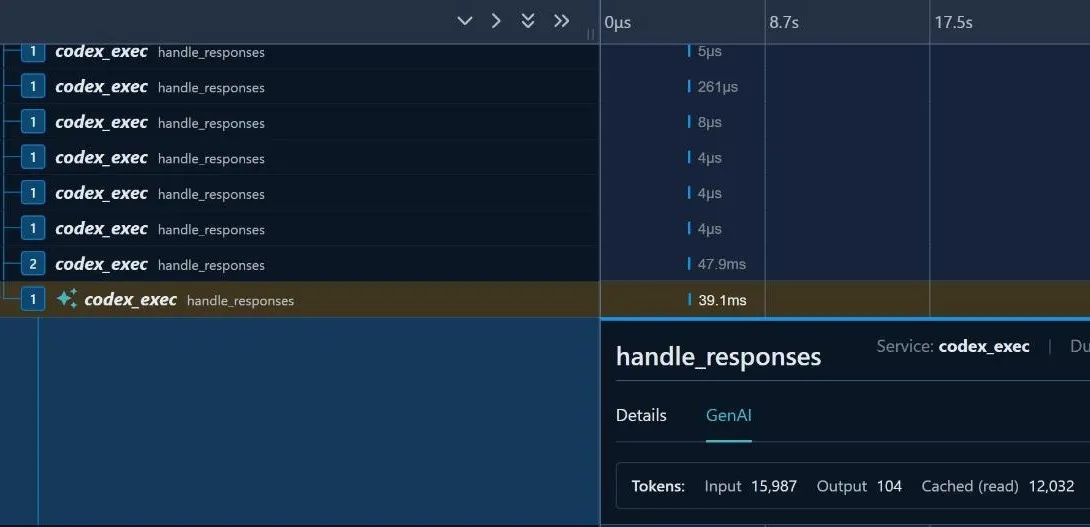
Codex gets tokens only, and only on the right span if you can find it. The tokens sit
on a 39 ms handle_responses span, surrounded by dozens of 4 µs spans with the same name.
There’s no model or provider. Jaeger’s Find box (gen_ai.usage.output_tokens) is the only
practical way to locate it.
The viewer and the task were the same for all three, yet one agent gets a full LLM view, one a partial one, and one almost nothing. The difference is in the attribute names.
How hosted backends ingest OpenTelemetry
All four hosted backends work the same way on the way in. You add an otlp_http exporter to
a collector (or point the agent at the backend directly) with:
- An endpoint, usually one per region.
- An auth header, sometimes with a routing header for the project or workspace.
- The signals you wire up. This is where they differ most.
On the server side, a mapping layer looks for conventions it recognises:
- the vendor’s own namespace (
langsmith.*,langfuse.*,braintrust.*); - the GenAI conventions (
gen_ai.*); - OpenInference (
openinference.span.kind,llm.*); - OpenLLMetry (
traceloop.*).
Spans that match become LLM-aware objects (a “generation”, an LLM “run”, an llm or
tool span) with model, tokens, cost and messages attached. Anything else becomes a plain
span, with its attributes kept as metadata.
| Logfire | LangSmith | Langfuse | Braintrust | |
|---|---|---|---|---|
| Traces | yes | yes | yes | yes |
| Logs | yes | not documented | no (/v1/logs returns 404) |
yes |
| Metrics | yes | not documented | accepted, then dropped¹ | not documented |
| Auth | Write token in Authorization |
x-api-key (+ project header) |
Basic auth with a key pair, plus an ingestion-version header | Bearer key + x-bt-parent project header |
gen_ai.operation.name |
drives its LLM and Agents views | chat → LLM run |
chat, execute_tool, invoke_agent all mapped¹ |
chat → LLM, execute_tool → tool |
| Special handling | a Claude Code session panel (undocumented; see below) | maps Claude Code’s span names | ||
| Limit that matters here | drops records older than 24 h | 25,000 runs per trace | 5 MB per request | 10 MB per trace upload |
| Self-host | Enterprise | Enterprise | MIT open source | Enterprise |
| Free tier | 10M records/month | 5k traces/month | 50k units/month, and every span is a unit | 1 GB/month |
¹ From Langfuse’s source code, where the docs were silent.
Langfuse bills every span as a unit, so a single ~4,700-span Codex run uses almost a tenth of the free tier.
Signals decide what you lose, and what leaks
Several things from Part 1 exist only in logs or metrics. The Logfire column is what I saw in the worked example below; the other three come from each vendor’s docs:
| Data | Lives in | Logfire | LangSmith | Langfuse | Braintrust |
|---|---|---|---|---|---|
Claude Code’s cost (claude_code.cost.usage) |
metrics | yes | no | no | no |
Claude Code’s per-request detail (api_request, tool_result, …) |
logs | yes | no | no | yes |
| Codex’s tool output, including file contents | logs | yes | no | no | yes |
Qwen Code’s prompts (default logPrompts=true) |
logs | yes | no | no | yes |
Qwen Code’s chat / execute_tool / invoke_agent spans |
traces | yes | partly | yes | partly |
This cuts both ways:
- With a traces-only backend, the privacy problems from Part 1 mostly stay home. Qwen’s prompt logging and Codex’s tool-output logging never leave your collector, because nothing downstream accepts logs.
- You also lose Claude Code’s cost and most of its per-call detail. Qwen Code is the agent that loses least, because it put its best information on spans with standard names.
- Send logs to Braintrust or Logfire and all of it arrives, good and bad.
So choosing a backend is partly a privacy decision, whether or not you meant it to be.
Most vendors’ coding-agent integrations skip OTel
Here’s the route each vendor’s docs recommend for these agents:
| Claude Code | Codex CLI | |
|---|---|---|
| Logfire | hooks plugin (reads transcripts), on Pydantic’s GitHub but not in the docs | native OTel or a hooks plugin |
| LangSmith | hooks plugin (reads transcripts) | hooks plugin (reads transcripts) |
| Langfuse | Stop hook (reads transcripts) | Stop hook (reads transcripts) |
| Braintrust | hooks plugin or native OTel | hooks plugin (rebuilds spans from the transcript) |
None of the four documents Qwen Code. LangSmith’s and Langfuse’s only documented native-OTel coding agent is GitHub Copilot.
The default is hooks that read the session transcript after each turn. Two vendors also document native OTel, each for one agent: Braintrust for Claude Code, Logfire for Codex. A transcript has two advantages. It holds the whole conversation, which the OTel defaults redact, and it doesn’t depend on how each agent names its spans.
Worked example: replaying the captures to Logfire
I picked Pydantic Logfire to test end to end. It accepts all three signals, it says it’s “built on OpenTelemetry”, and it has a SQL API I could use to check exactly what arrived.
Replay instead of re-run
I didn’t need to re-run the agents to try a backend. The captures from Part 1 are already OTLP (each JSONL line is one export request), and the collector can read them back in.
Before sending anything, I checked what was left after deleting the identity keys. The stripped Codex data still named my MCP servers and an internal API hostname. Qwen’s logs still held my username in file paths, plus the contents of its memory notes.
Did it all arrive?
The query API takes SQL over Logfire’s records and metrics tables, authenticated with a
read token:
curl -X POST https://logfire-eu.pydantic.dev/v2/query \
  -H "Authorization: Bearer $LOGFIRE_READ_TOKEN" -H 'Content-Type: application/json' \
  -d '{"sql": "SELECT service_name, kind, count(*) FROM records GROUP BY 1, 2",
       "min_timestamp": "2026-10-10T00:00:00Z"}'
Everything arrived:
- Every span, log record and metric datapoint, with counts matching what was sent: 30 spans, 49 logs and 40 datapoints from Claude Code; 4,710 spans, 48 logs and 222 datapoints from Codex; and 95 spans and 776 datapoints from Qwen Code.
- No ingest errors and no identity keys.
- Claude Code’s cost metric survived intact at $0.00799, matching the CLI’s own figure. Logfire is the only one of the four that documents accepting metrics, so it’s the only one I’d expect to hold that number.
What Logfire showed
I expected Qwen Code to come out best, as it did in Jaeger, and I counted spans with the
gen_ai.* fields that Logfire’s docs say its LLM views read. Then I opened the UI.
Claude Code gets its own panel. Click a claude_code.llm_request span and the first
tab is Session, built from Claude’s log events. It opens with a summary card for the
whole session, showing:
- the duration (24 s) and cost ($0.00799);
- input, output and cache token totals;
- the model and how many calls it made (
claude-haiku-5-5×8); - the tools used (Edit ×4, Bash ×3), and “7/7 tools succeeded”.
Below the card is a timeline of the session’s events:
- the prompt (redacted, with its length);
- each API request with its duration and tokens;
- each tool decision (“accept, via config”);
- each tool result with duration and size.
Claude’s log records carry trace context, so Logfire also nests them inside the trace.
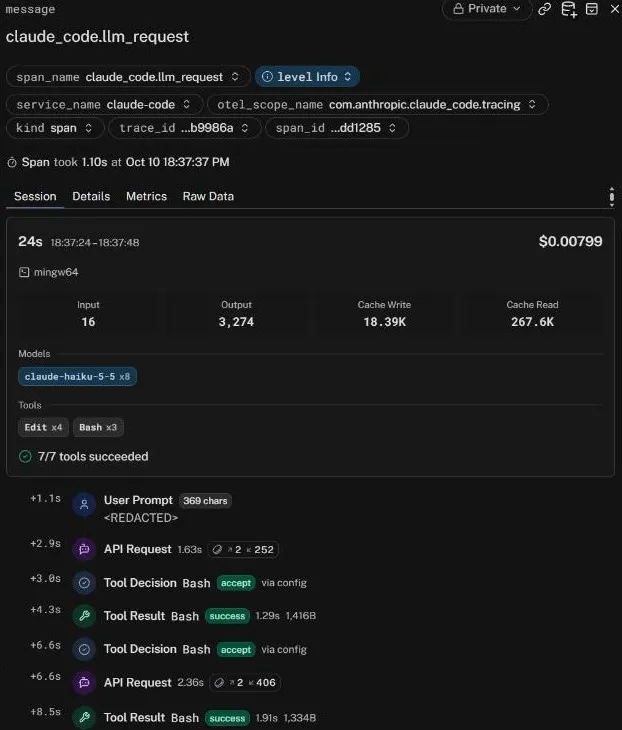
So in Logfire, Claude Code’s tokens and cost are visible after all, per call and for the
whole session. They come from its logs
rather than from gen_ai.usage.* on spans, through a Claude Code-specific integration that
isn’t in Logfire’s docs. It also means the backend that accepts logs is the one that can
show this, and a traces-only backend never could.
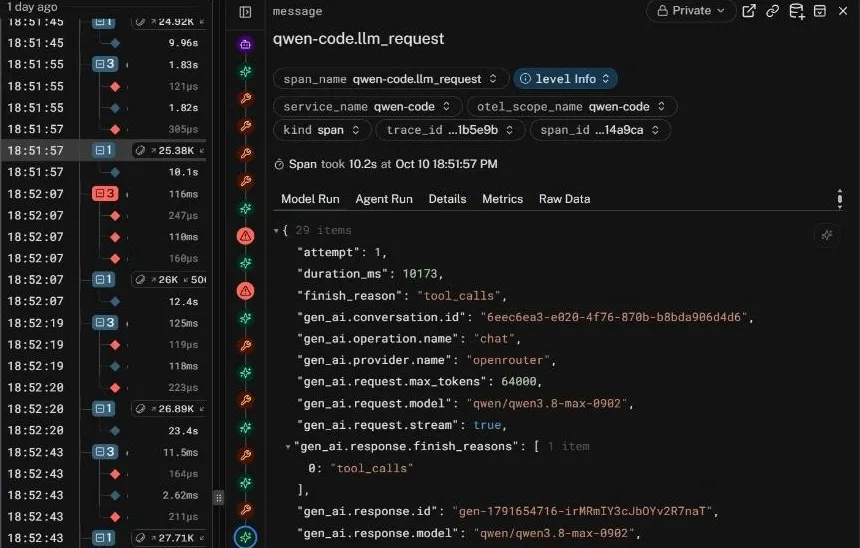
Qwen Code gets the generic GenAI treatment. LLM spans carry token badges, and the
interaction row rolls up the whole trace (↑348.3K ↓7,233 tokens). Spans open on Model
Run and Agent Run tabs. Logfire stamps them at ingest as model-call and agent-run
candidates. In default-privacy mode there are no messages to render, so those tabs show the
gen_ai.* attributes. Qwen also reports a per-call context-window breakdown (system prompt,
built-in tools, memory files, messages), which neither of the others sends.
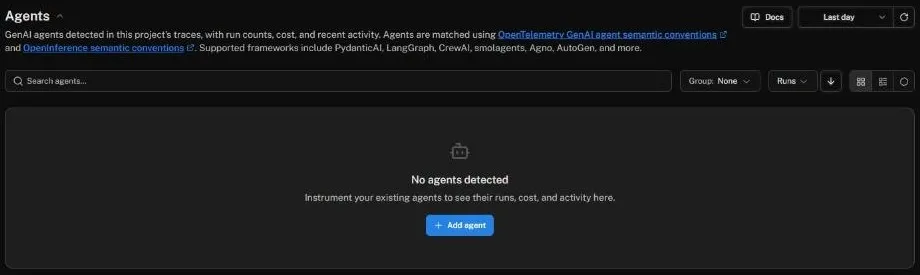
The Agents view stayed empty. Over both 6 and 24 hours it said “No agents detected”.
That’s despite Qwen’s span carrying gen_ai.operation.name=invoke_agent,
gen_ai.agent.name, a conversation ID, and Logfire’s own agent-run-candidate flag. The
docs don’t say why. One guess is that the conventions name that span invoke_agent {agent name}, and Qwen calls it qwen-code.interaction, but I haven’t tested that.
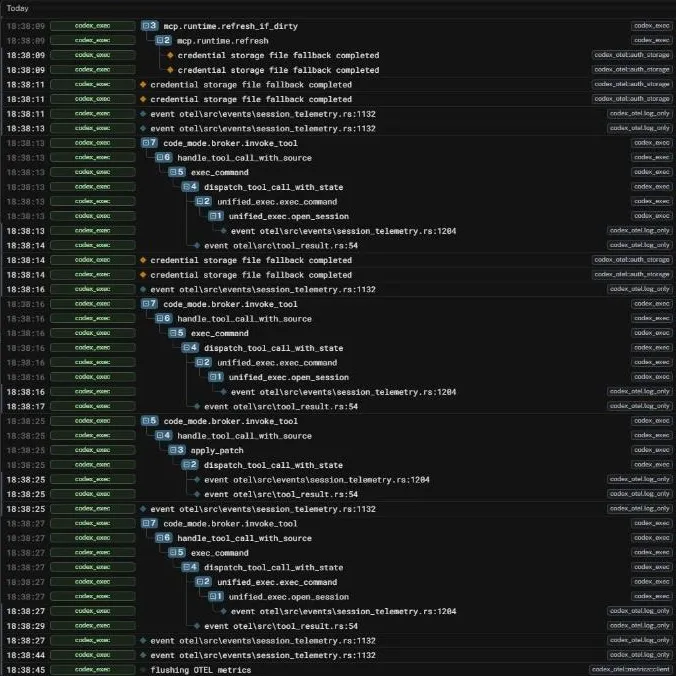
Codex gets nothing LLM-specific.
- Its
persist_rollout_itemsandrealtime_conversation.running_statespans flood the Live view. - Its log records show up labelled by Rust source location, such as
event otel\src\tool_result.rs:54. That’s because Codex puts the source location in OTLP’s standard event-name field, and its documented name (codex.tool_result) in anevent.nameattribute instead. Logfire displays the standard field. - The per-call LLM data does exist, in
response.completedlog events carrying the model, token counts and time to first token. But they open only on a generic attributes tab.
Choosing a backend for coding-agent telemetry
From this sample of three agents and four backends:
- If you want everything, including cost and Claude Code’s per-request detail, you need a backend that takes logs and metrics. Logfire is the only one of the four documented to accept all three signals, and it showed the most.
- If you’d rather prompts and tool output never leave the building, a traces-only backend does that by default. Know what you’re giving up, and scrub values in the collector anyway.
- If you need to self-host on open source, Langfuse is the only option of the four. It’s traces-only.
- Qwen Code works reasonably everywhere, because it speaks the standard.
- Claude Code works best where someone special-cased it: Braintrust’s span-name mapping, and Logfire’s session panel.
- Codex works best through the vendors’ hook-based plugins, not its own OTel.
The standard is only as good as the names
All three agents speak OpenTelemetry, and all five backends accept it. How useful the result is depends on whether everyone uses the same names, and mostly they don’t yet.
If you build an agent, the most valuable thing you can do for your users’ observability
is the boring one. Use the gen_ai.* names and put them on the right spans. If you build
a backend, document what you special-case. I only found Logfire’s Claude Code panel by
clicking on it.
Addendum: DeepSeek Harness (12 October 2026)
Part 1’s addendum added a fourth agent: DeepSeek Harness, with LoongSuite’s OTel plugin for traces and metrics, and DeepSeek’s own exporter for logs. Here’s where its data lands.
Jaeger’s GenAI tab fills completely, as it does for Qwen Code. A chat span shows the
agent name, operation, provider, model, and input, output and cached tokens. Tool spans get
the tool icon and a “Tool Call: pwsh” label. Only time to first token lands under “Other
GenAI attributes”, because of its non-standard name.
The plugin is written with hosted backends in mind. Its README includes a Langfuse setup.
It also hard-codes a Langfuse attribute (langfuse.observation.completion_start_time) and an
Alibaba Cloud one (acs.arms.service.feature). The signal question is easier here than with
the other three: by default the plugin puts everything useful on spans, so a traces-only
backend misses nothing but two metrics. Logs only appear if you switch on DeepSeek’s exporter.
Those are the raw session log, with no per-run tag because that exporter ignores
OTEL_RESOURCE_ATTRIBUTES, so think twice before sending them anywhere.
In Logfire (replayed, checked with SQL and in the UI), everything arrived: 44 spans, 56 log records and 6 datapoints from two runs.
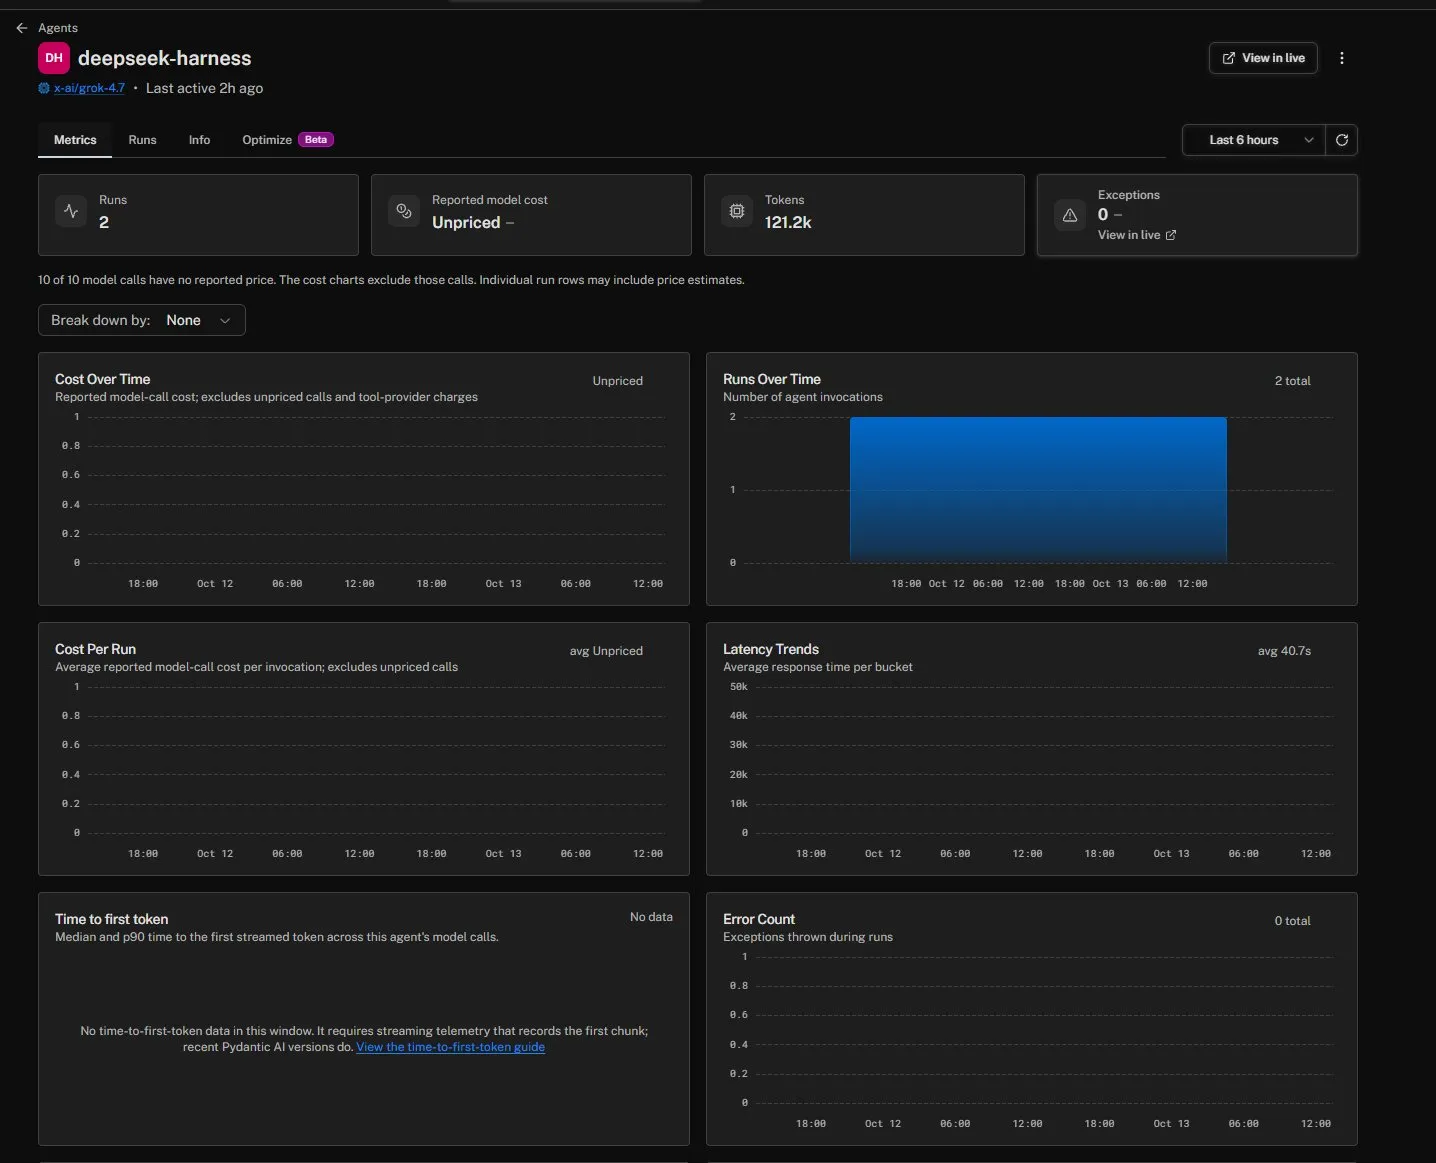
The Agents view works, and works well. Where Qwen Code got “No agents detected”, DSH gets an agent page with runs, tokens, latency and errors over time. It also has a run list showing conversation ID, model, duration and tokens.
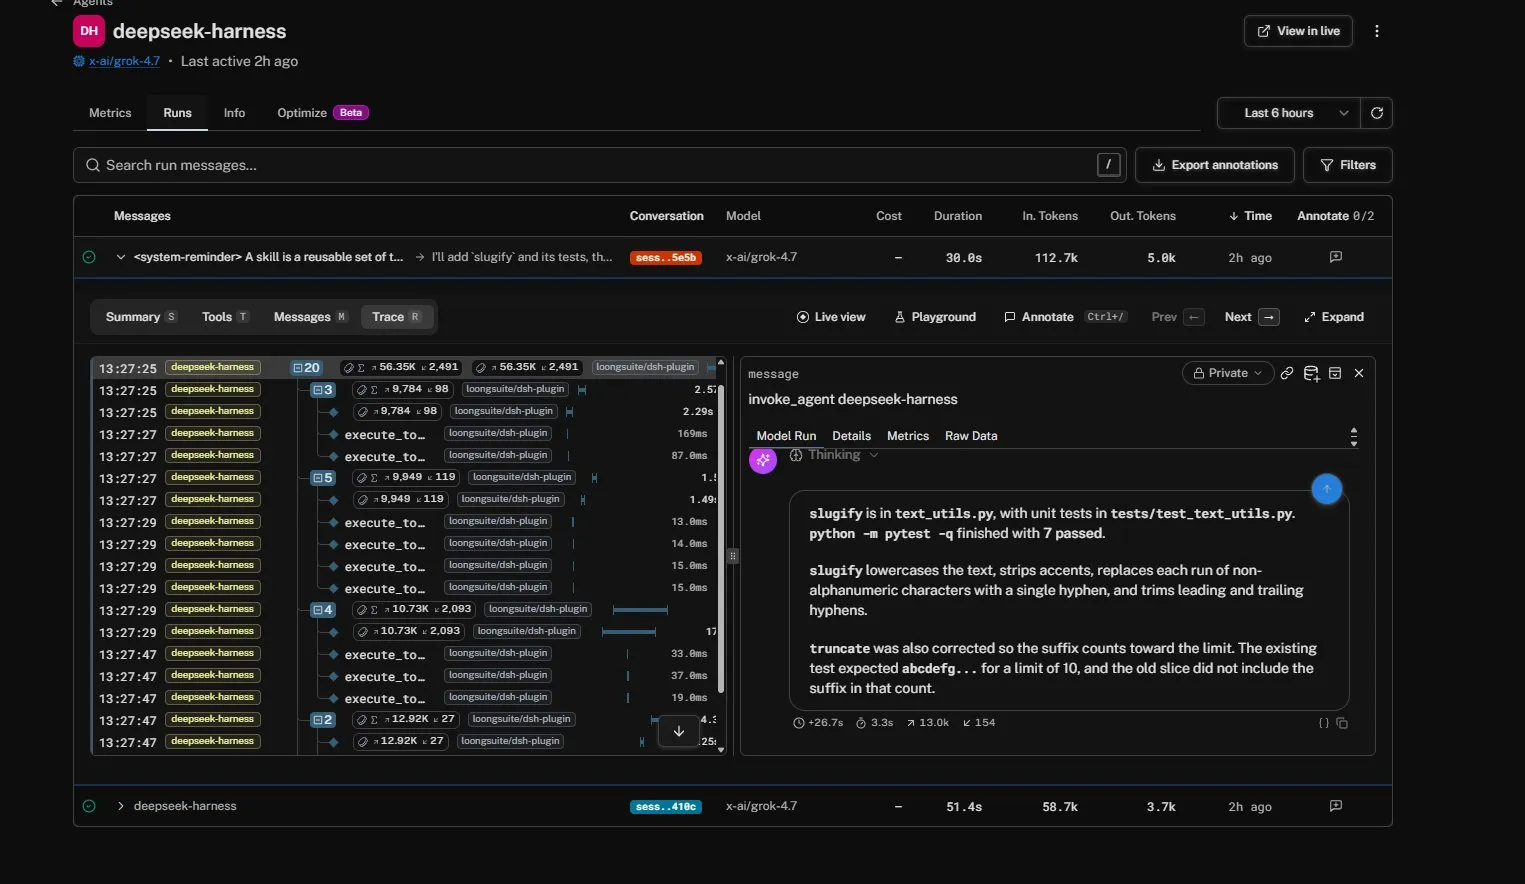
Open a run from the full-content round and you get four tabs:
- a summary, with the input and the final output;
- every tool DSH offered the model, with how often each was called;
- the conversation, rendered as messages and tool calls;
- the trace, with token roll-ups at each step.
Logfire flags both agents’ spans as agent-run candidates, so the flag isn’t what decides it. DSH’s agent span differs from Qwen’s in three ways:
- it’s named
invoke_agent deepseek-harness, the conventions’ pattern; - it sits under an entry span instead of at the root;
- it’s also flagged as a model call.
That supports the span-name guess above, though with three differences it doesn’t prove it.
A few rough edges:
- The time-to-first-token chart says “No data”. It needs the conventions’ attribute, and
DSH sends its own
time_to_first_token. - One total is doubled. The agent-level figures are right: 121.2k tokens over 10 model
calls for the two runs. But open a run and its summary shows 112.7k input tokens for a run
that used 56.4k. It adds the
invoke_agentspan’s turn totals, which Logfire also flags as a model call, to thechatspans’ own. - The run’s “input” is DSH’s skill catalog, not the prompt. Logfire shows the
conversation’s first message, and DSH puts a list of my installed skills (from
~/.agents/skills) ahead of the prompt. Part 1’s “your setup leaks too”, in content mode. - DeepSeek’s logs arrive as 56 one-record traces, each named
log. They carry no trace context and no event name. The record type is in anevent.typeattribute and the content in Logfire’slog_bodycolumn. The only way to join them to the plugin’s trace is the session ID.
One change to the replay: the plugin’s service.instance.id is <service>@<hostname>:<pid>,
so the strip rule now deletes that key on resources too.