Following on from my previous work looking at coding agents and their OTel exports, I wanted to see whether I could follow a single user action through a whole application. From a click in the browser, through backend services and AI agents, down to SQL queries and outbound HTTP calls.
The test I came up with combines TypeScript, Python and C#, two web frameworks, two MCP SDKs and two agent frameworks. A deliberately mixed stack, all sending telemetry through an OpenTelemetry Collector to Logfire.
The application itself is straightforward. A user asks whether a product can be delivered to a particular destination. A Python agent passes the request over MCP to a warehouse service, where a .NET agent checks stock and gets a shipping quote. The SQL query and shipping request run concurrently, and the results make their way back to the user.
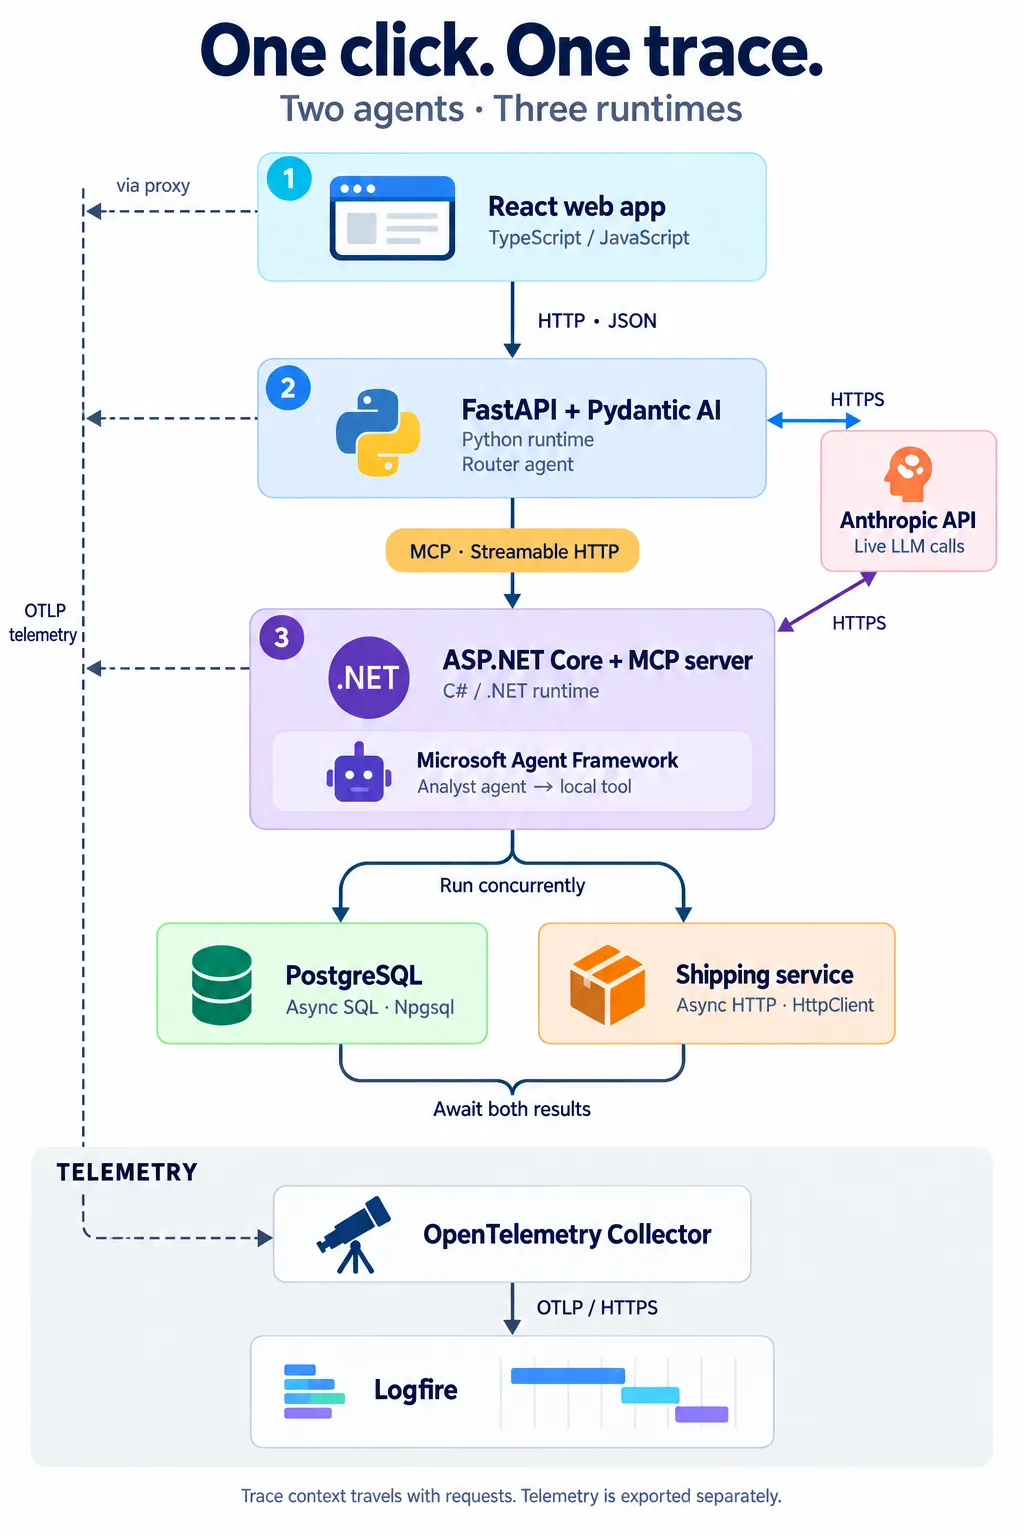
I wanted that whole journey to appear in one trace. Every span needed to share the browser’s trace ID and point to the correct parent, with both downstream calls visibly overlapping under the tool that started them. Getting all the services to send telemetry to the same place was only the starting point.
The Click
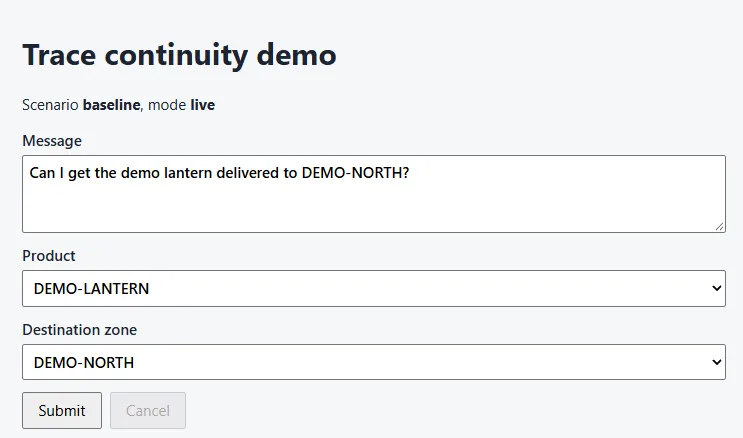
The page is deliberately plain: a question, a product, a destination zone, and Submit.
| Before | After one click |
|---|---|
 |
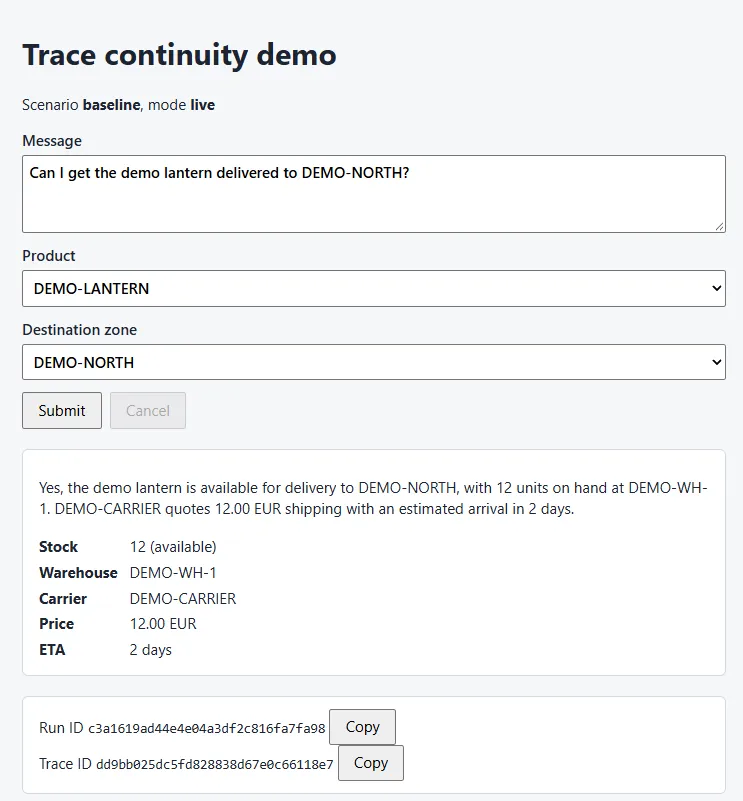 |
Claude generated the answer from the stock and shipping results shown below it: stock from
PostgreSQL and the quote from the shipping service. Then come two ids, the server-generated run_id and the
trace_id. The trace id is for diagnostics only and grants no access to anything.
In the browser’s network log the click is one application request. For this click, the browser also sent two telemetry exports.
POST /api/ask               200   the click
POST /telemetry/v1/traces   200   OTLP export via the gateway
POST /telemetry/v1/logs     200   OTLP export via the gateway
The instrumented fetch sent this request. Browser-added headers are omitted.
POST /api/ask
content-type: application/json
traceparent: 00-dd9bb025dc5fd828838d67e0c66118e7-522e1ea335eb0820-01

{"message":"Can I get the demo lantern delivered to DEMO-NORTH?","product_code":"DEMO-LANTERN","destination_zone":"DEMO-NORTH"}
The application code sets the first header. The fetch instrumentation adds traceparent: trace id
dd9bb025… and parent 522e1ea335eb0820, which is the browser’s POST span. The final 01 marks the request as sampled.
What came back:
{
  "run_id": "c3a1619ad44e4e04a3df2c816fa7fa98",
  "answer": "Yes, the demo lantern is available for delivery to DEMO-NORTH, with 12 units on hand at DEMO-WH-1. DEMO-CARRIER quotes 12.00 EUR shipping with an estimated arrival in 2 days.",
  "evidence": {
    "product_code": "DEMO-LANTERN",
    "destination_zone": "DEMO-NORTH",
    "available": true,
    "quantity_on_hand": 12,
    "warehouse": "DEMO-WH-1",
    "shipping": {
      "destination_zone": "DEMO-NORTH",
      "carrier": "DEMO-CARRIER",
      "price_cents": 1200,
      "currency": "EUR",
      "eta_days": 2,
      "reference": "CANARY-SHIPREF-5b1e"
    },
    "summary": "DEMO-LANTERN is available for DEMO-NORTH: 12 units on hand at DEMO-WH-1. DEMO-CARRIER quotes 1200 EUR cents (12.00 EUR) with an ETA of 2 days."
  },
  "trace_id": "dd9bb025dc5fd828838d67e0c66118e7",
  "scenario": "baseline",
  "mode": "live"
}
The response contains the same trace ID the browser sent in traceparent. That gives me a starting point: the API is using the browser’s trace. Next, I wanted to see whether that same trace continued through both agents, across MCP, and into the SQL and HTTP calls.
The complete live waterfall
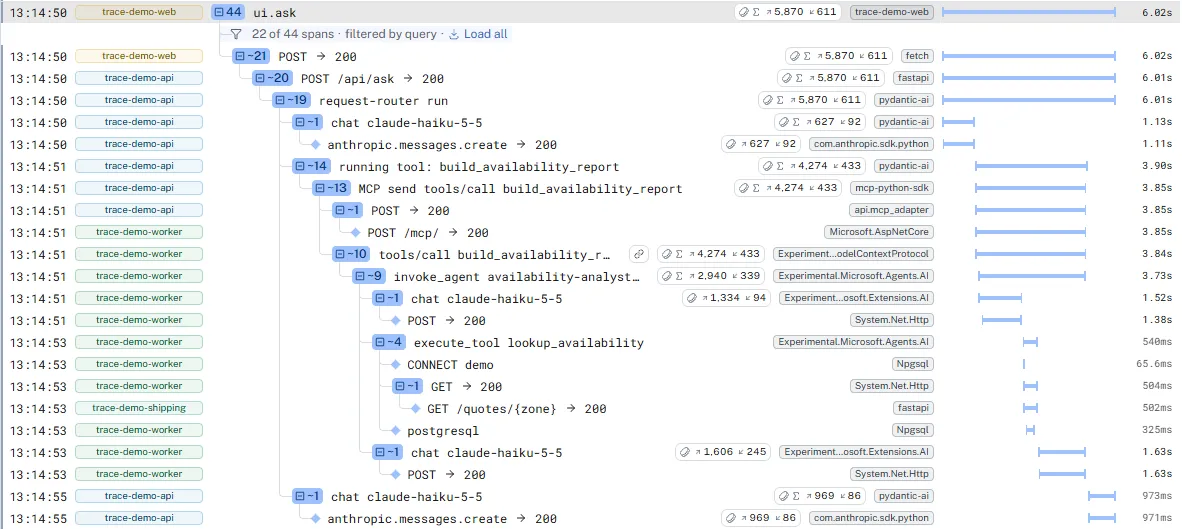
That click produced 23 spans across four services, in one trace, and 12 log records, each attached to the span that was active when it was written. The whole thing took 6.0 seconds.
This is the trace in Logfire, with logs and span events filtered out:
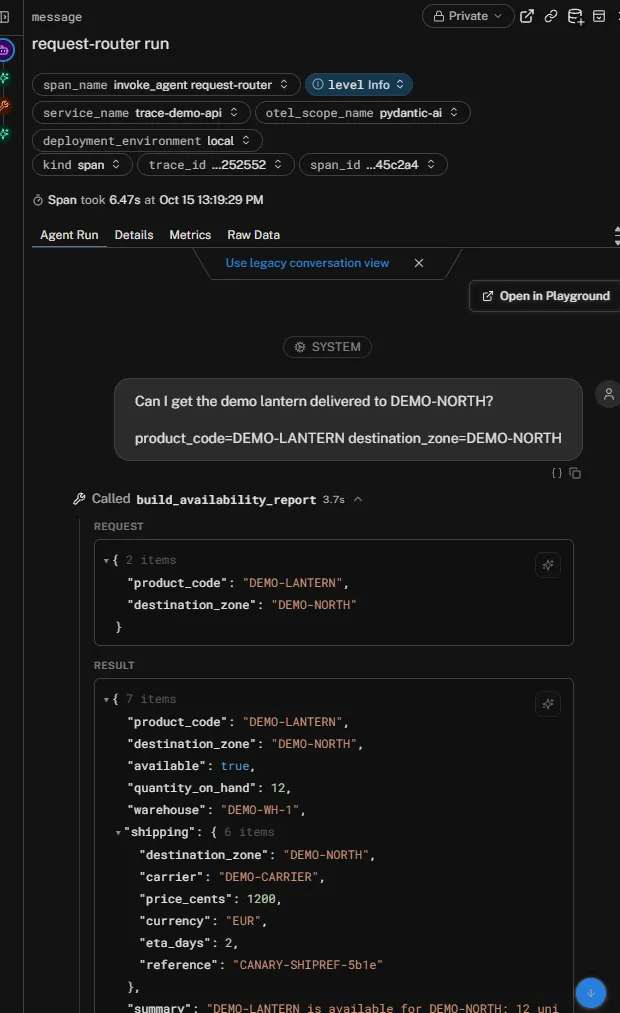
| Python Router Agent | .net Analyst Agent |
|---|---|
 |
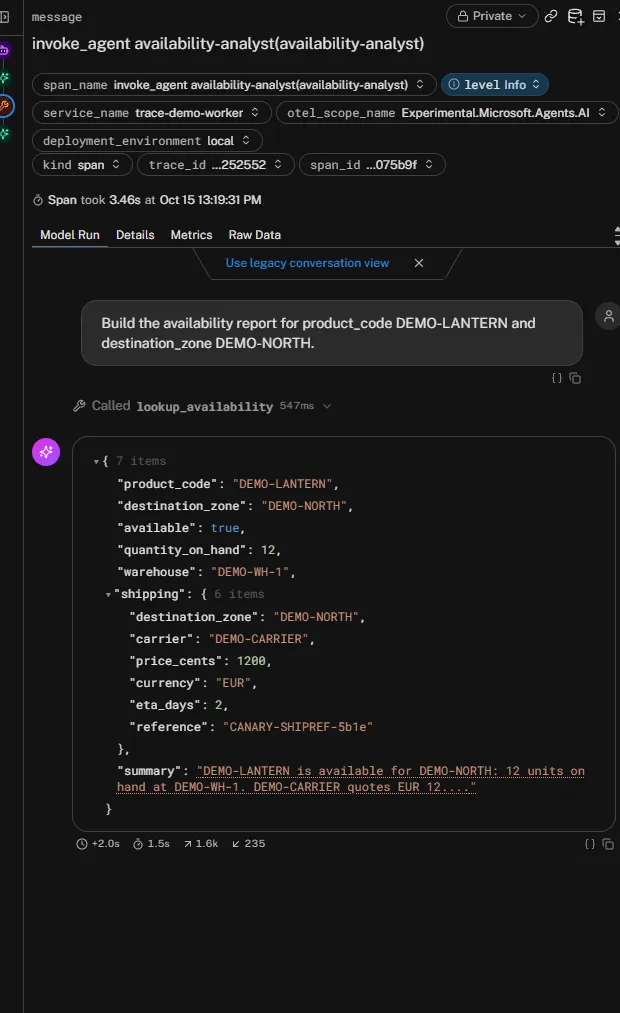 |
These screenshots come from a separate run with content capture enabled for the synthetic demo data. Logfire renders both conversations, although it labels the Python span “Agent Run” and the .NET span “Model Run”.
I checked the parent relationships and timings against the raw OTLP captured by the Collector:
- Browser→API and Python→.NET are each correct direct HTTP pairs.
- The .NET MCP operation’s parent is the Python MCP span.
- Each agent is an ancestor of its tool work.
- SQL and HTTP share the tool as parent and overlap.
This is the trace after getting the whole chain connected.
Getting the trace connected
So did all of this fall into place automatically when it was wired up?
The MCP calls were being traced, but their underlying HTTP requests weren’t. I initially added a small wrapper after looking for HTTPX2 instrumentation under the wrong package name. It turns out HTTPX2ClientInstrumentor lives in the existing opentelemetry-instrumentation-httpx package. Enabling it on the MCP client supplied the missing HTTP spans and trace headers, and replaced the wrapper.
Even before that fix, the .NET agent was still connected because the HTTP header wasn’t the only place carrying trace context.
The MCP client also put it inside the JSON-RPC message, in params._meta.
The two copies describe different operations. The HTTP header identifies the outgoing HTTP span. The message metadata identifies the MCP call being transported. On the .NET side, the HTTP server and MCP handler each pick up the context intended for them.
Both carriers contain the same trace ID, but identify different parent spans. The .NET MCP span takes the Python MCP span as its parent and links to the ASP.NET request span. That link records the relationship to the HTTP request without making it the parent.
To check what each carrier was doing, I removed the trace context from each one in turn
- HTTP trace header removed: the ASP.NET span roots a brand-new trace, yet the MCP operation and everything below it
stays in the browser’s trace via
_meta— and its link now points across traces. - Trace context removed from _meta: the trace id survives end to end via the header, but the MCP operation’s parent silently becomes the ASP.NET span. The spans still appear in one trace, but checking the parent IDs reveals the changed relationship
- Both removed: every .NET span lands in one separate trace.
Seeing both agents in the same trace hadn’t been enough to tell me the HTTP layer was connected too. MCP’s message-level propagation had kept the tool call attached while the transport tracing was missing.
Five requests, five traces
One final test I wanted to prove out. Do separate traces running through the systems at the same time stay separate? Or could spans from one parallel run bleed into another’s?
I did this the manual way - opened the page on 5 tabs and clicked Submit in each, one after another, while the earlier ones were still running.

The result is clean - 5 unique, concurrent and fully intact runs in Logfire.
I can confirm that by using the SQL feature in Logfire. The query shows five separate trace IDs, each with four services, one API request, one MCP tool call and one SQL query
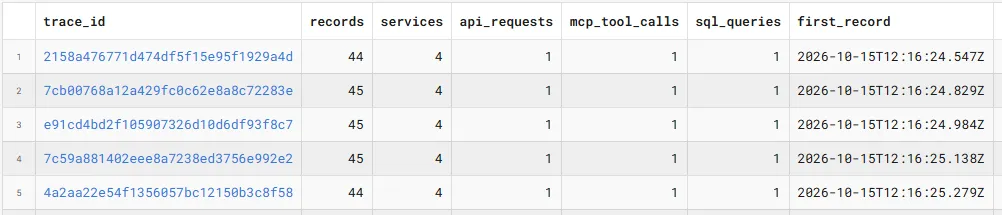
No context leaked between requests in this test.
Try it yourself
The code is on GitHub, including the setup instructions, pinned dependencies, and experiments for removing trace context at different points in the chain.
This was a local demonstration with real model calls, a seeded database, and a controlled shipping service.
I haven’t tested cross-origin deployment or sampling, so those remain outside what this example demonstrates.
The result I wanted was there: one browser action could be followed through both agents, across MCP, and into the SQL and HTTP calls. Checking the parent relationships showed whether every layer was connected.