Part 1 of 2. Part 2 sends this data to Jaeger and Pydantic Logfire, and compares LangSmith, Langfuse and Braintrust from their docs.
Most terminal coding agents now say they “support OpenTelemetry”. I picked three that between them cover the range: Claude Code, OpenAI’s Codex CLI and Qwen Code. It’s a deliberately mixed sample, not a ranking (more on why these three below). All three export traces, logs and metrics to any OTLP endpoint you point them at. So I pointed them at the same local collector, gave them the same small coding task, and kept every record they sent.
Three things stood out before I’d even opened a trace viewer:
- Codex sent about 4,700 trace spans for a 35-second task. Most of them are its internals: filesystem metadata reads, config loading, and a span for nearly every streamed response event.
- Qwen Code’s default telemetry can include what it remembers about you. With its
default
logPrompts=true, its background memory extractor’s reads and writes of~/.qwen/memories/end up in the exported logs, along with your prompt and the files it read. - Swapping the model changed nothing about the telemetry’s structure. Claude Code on Opus or on Haiku, Codex on two different GPT-6 models, Qwen Code on Flash or on Max: each agent sent the same span names and the same attribute keys every time.
“Supports OpenTelemetry” covers the formats and transport. What gets sent is a product decision each vendor made, and they made three very different ones. Claude Code sends tidy product analytics. Codex sends a profiler dump. Qwen Code follows the GenAI semantic conventions most closely of the three, and has the loosest privacy defaults.
Why capture this at all?
Why I want to capture it? Because I’m interested in OTel and wanted to see what was being sent.
Why would someone using a coding agent on their own want to? They probably don’t. The agent already shows you what you need.
But if you’re running a team, or working across several agents and model providers, then you might want to be aggregating this information. The agent is software running on every developer’s machine, spending money, running shell commands and reading the codebase. You probably want to know what it’s doing, the same as for any other service you run. The telemetry answers questions like these:
- What is this costing, and who’s spending it? Tokens and cost per session, per model and per developer. Claude Code reports cost directly; for the others you work it out from token counts.
- Why is it slow, or why did it fail? Where a run’s time goes: waiting for the model, running tools, retrying. Finding 4 does this for one slow agent, from its spans alone.
- What did it do? Which tools and commands it ran, whether each tool call was approved or auto-accepted, and which plugins and MCP servers it loaded. That’s an audit trail, and an early warning when an agent starts doing something it shouldn’t.
- Is it any good compared with the alternatives? The same task across agents or models: round trips, tool calls, tokens and time. That’s how this post compares three.
Vendors have their own usage dashboards, but OpenTelemetry is the one format all of these agents can send. It lets you put every agent your team uses into the observability stack you already run, next to your other services, and keep the data on your own infrastructure.
OpenTelemetry in 120 seconds
If you already know OTel, skip ahead.
OpenTelemetry (OTel) is a vendor-neutral standard for three kinds of telemetry, that pre-dates LLM’s and Agents:
- Traces are trees of spans. A span is a named, timed operation (“call the model”, “run a tool”) with key-value attributes and a parent. Viewed as a waterfall, a trace shows what happened, in what order, and where the time went.
- Logs are timestamped records. They can be a plain line of text or a structured event with named fields, and either kind can carry the trace and span it happened in.
- Metrics are numbers aggregated over time: counters, gauges, histograms.
Programs push all three over OTLP (gRPC or HTTP), usually to a collector. The collector can filter and transform the data, then forward it to one backend or several at once:
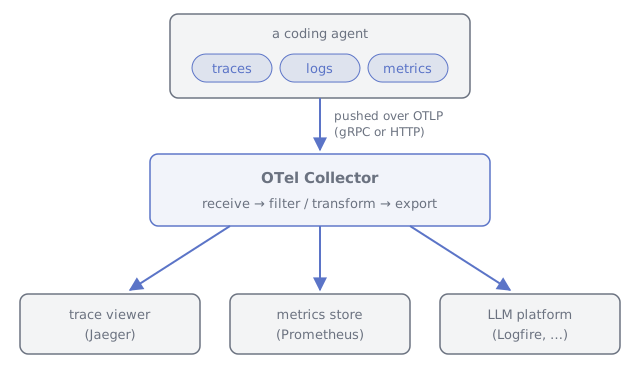
The collector is optional, since a program can push straight to a backend. But it’s where you get to fan data out, filter, or scrub it before it leaves your machine.
The standard covers the transport and the data model, but attribute names are mostly up
to you. That’s where semantic conventions come in: names the OTel project
standardises for common things such as HTTP requests and database calls. The GenAI
semantic conventions do the same for LLM work, with names such as
gen_ai.operation.name (chat, execute_tool, invoke_agent), gen_ai.request.model,
gen_ai.provider.name and gen_ai.usage.input_tokens.
They’re an official part of OTel, but every piece is still marked Development
(experimental), and the names are still moving: gen_ai.system became
gen_ai.provider.name in 2025, and the token-usage metrics are being reworked now.
Backends that understand these names can show you model calls, token counts and agent
runs without knowing anything about the program that sent them. That’s where the three
agents part ways.
Who supports what, and why these three
Here’s where seven well-known coding agents stand. I tested the first three. The rest come from each project’s docs and source code, checked on 10 October 2026.
| Agent | Traces | Metrics | Logs | Attribute naming | Content exported by default |
|---|---|---|---|---|---|
| Claude Code (tested) | yes (beta flag) | yes | yes | own claude_code.*, a few gen_ai.* |
prompt redacted; your email on every record |
| Codex CLI (tested) | opt-in; span names undocumented | yes (default exporter sends to OpenAI) | yes | codex.* events, internal span names, gen_ai.usage.* |
prompt redacted; tool arguments and output, including file contents |
| Qwen Code (tested) | yes | yes | yes | GenAI conventions + qwen-code.* |
prompts and file contents, in logs |
| GitHub Copilot CLI | yes | yes | span events only | GenAI conventions + github.copilot.* |
off; pseudonymous user ID |
| Gemini CLI | yes | yes | yes | mostly gemini_cli.*, some gen_ai.* |
prompts, in logs; your email when signed in |
| OpenCode | experimental | no | yes | Vercel AI SDK (ai.*, gen_ai.*) |
prompts, once its LLM spans are switched on |
| Cursor (incl. CLI) | no | Enterprise only, sent from Cursor’s servers | Enterprise only, sent from Cursor’s servers | cursor.* |
usage only; CLI prompt text isn’t exported |
The GenAI conventions are maintained by people from Google and Microsoft. The approvers listed in the repo come from Google, Microsoft, Splunk, Honeycomb, Alibaba and Pydantic. The two agents that follow the conventions most closely come from companies on that list:
- Copilot CLI, from GitHub (part of Microsoft);
- Qwen Code, from Alibaba.
Claude Code and Codex come from the two big labs that aren’t on it, and they mostly use their own names.
It isn’t a clean rule. Google co-maintains the conventions, yet Gemini CLI mostly uses its
own gemini_cli.* names. And with every part of the conventions still experimental,
there’s a fair argument for not building on them yet. Still, nearly every observability
backend already keys on gen_ai.*, so an agent that skips it is the one that loses out.
Why these three. I chose them for range, not size.
- Claude Code and Codex are the two most-used terminal agents in this year’s developer surveys. 65.5% and 29.5% of Stack Overflow’s 2026 respondents had used them in the past year, and JetBrains’ 2026 survey found 39% and 16% using them at work. They also take opposite approaches to telemetry.
- Qwen Code is much smaller. Alibaba hasn’t published usage figures, it wasn’t an option in either survey, and it gets about 80,000 npm downloads a week against Claude Code’s 12 million. I included it because it’s open source and follows the GenAI conventions closely. It inherited much of that from Gemini CLI: Qwen Code was “originally based on Google Gemini CLI v0.8.2”, and its telemetry module still carries Google’s copyright headers. That makes it a good test of what following the conventions gets you.
Two others would make good additions:
- Copilot CLI is the convention-following agent with the big user base. Its docs
describe an
invoke_agent→chat/execute_toolspan tree, though it exports over HTTP only and has no separate log signal. - OpenCode is third among terminal agents in both surveys. Its OTel support is still experimental and mostly undocumented.
The setup
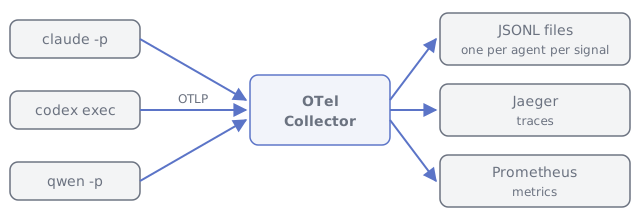
Everything ran locally on one Windows 11 machine. The collector writes
every export request to JSONL, grouped by service.name, so each agent’s output
can be compared record by record.
The task. Each agent got the same headless prompt against a tiny Python repo:
Add a function
slugify(text)to text_utils.py … Add unit tests for it … Then run the test suite withpython -m pytest -qand make the whole suite pass.
The repo has one deliberately failing test (an off-by-one in an existing truncate
function), so “make the whole suite pass” forces a second edit and a re-run. That means
every agent has to read files, edit files, run a shell command, and loop.
The canaries. Two unique strings make leaks easy to spot: one appears only in the prompt, the other only inside a source file. If either turns up in a capture, that agent exported your prompt or your file contents.
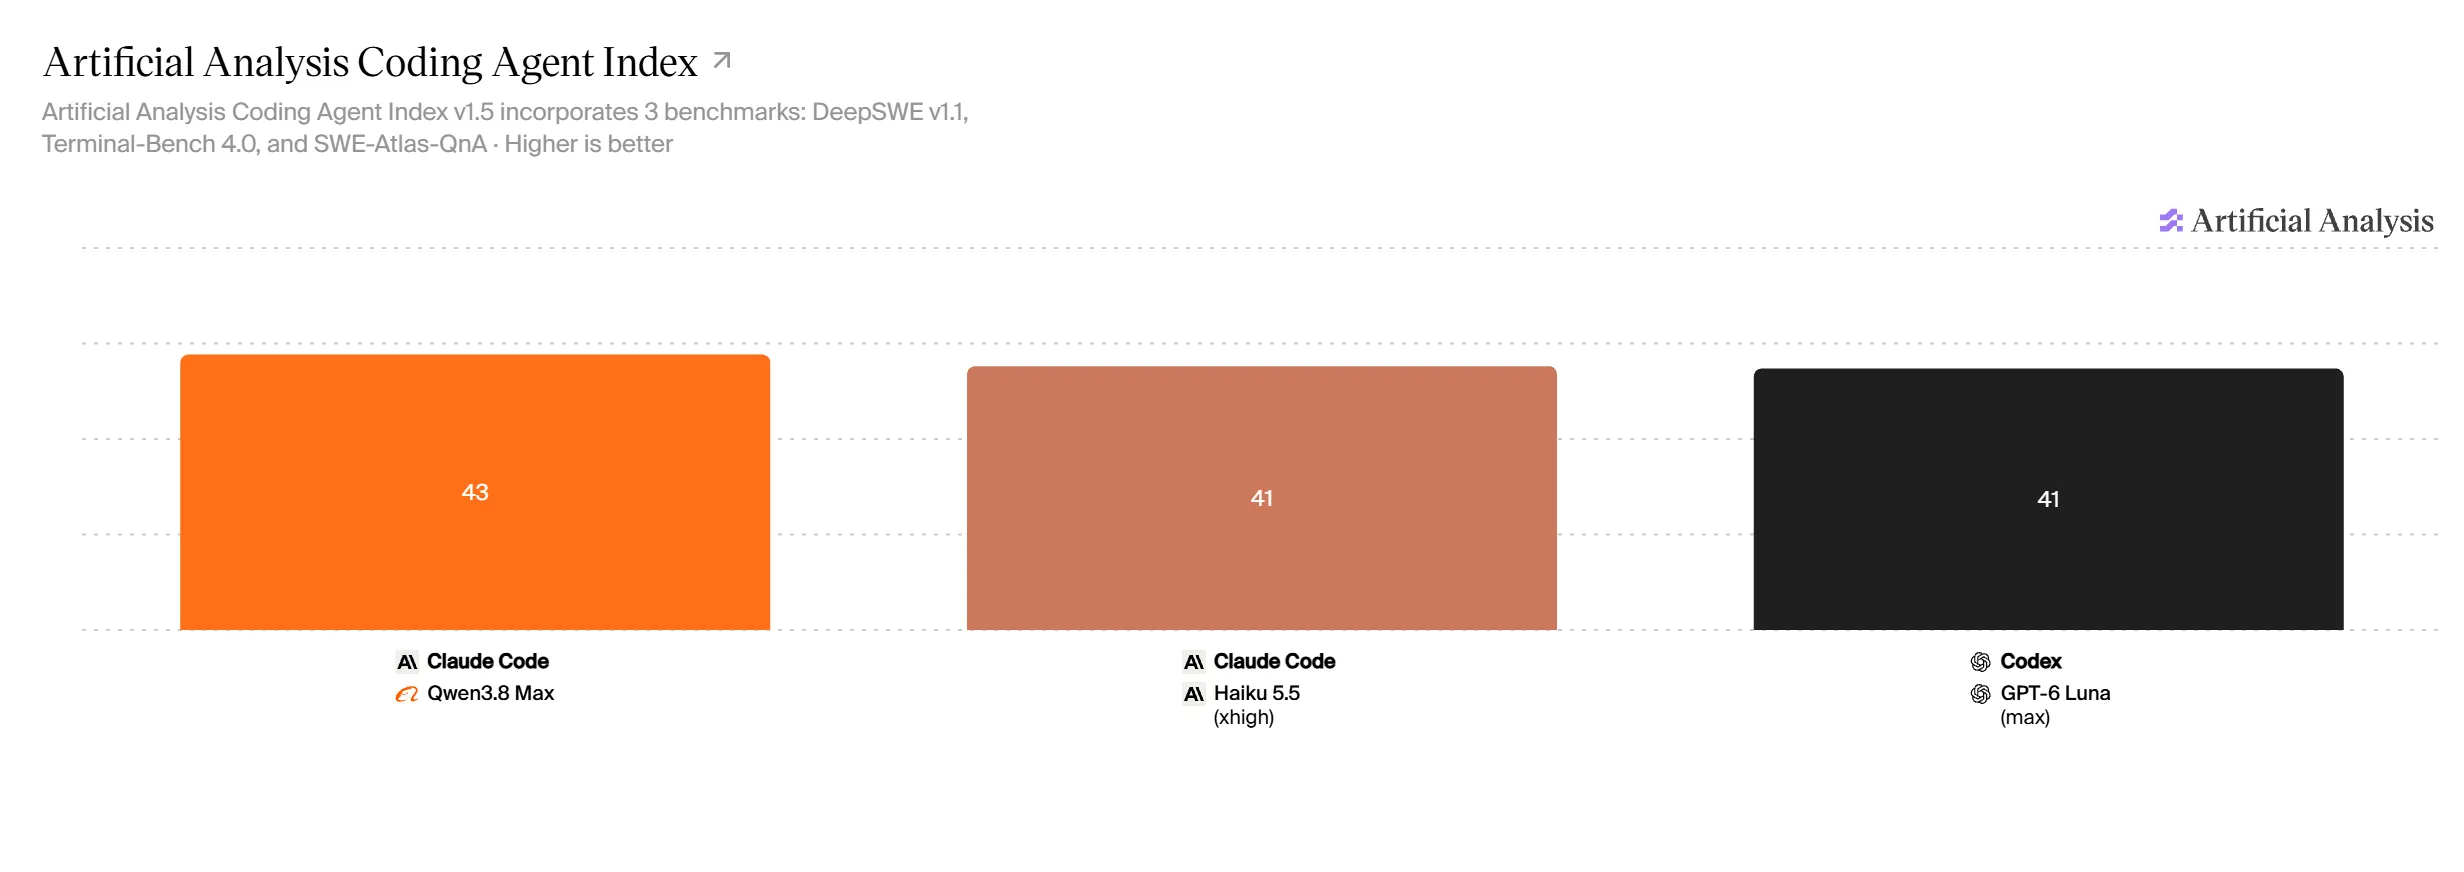
The runs. For the numbers I used comparable tiers rather than each agent’s default model: Claude Code on Claude Haiku 5.5, Codex CLI on GPT-6 Luna, and Qwen Code on Qwen3.8 Max (via OpenRouter).
Caveats, briefly.
- Three runs per agent is enough for structure, but timings and token counts are anecdotes.
- Tokenizers differ, so I only compare token counts within an agent, never across agents.
- “Default settings” here means default for my machine. Each agent also loaded my user-level plugins, MCP servers and hooks. That turns out to be a finding too.
Finding 1: the telemetry belongs to the agent, not the model
I compared the exact set of span names and attribute keys across every default-privacy run (four per agent, on two different models each):
| Span names | Span attribute keys | |
|---|---|---|
| Claude Code (Opus 5.5 and Haiku 5.5) | 5, identical every run | 46, identical every run |
| Codex CLI (GPT-6 Astra and GPT-6 Luna) | 157, identical every run | 102, identical every run |
| Qwen Code (Qwen3.8 Flash and Qwen3.8 Max) | 6, identical every run | 65-67 (a few optional keys come and go) |
The model changes how long things take and how many calls happen. The agent sets the vocabulary. So everything below describes the agent, whichever model you run it on.
Finding 2: three very different trace shapes
Medians over three runs:
| Claude Code | Codex CLI | Qwen Code | |
|---|---|---|---|
| Spans | 30 | 4,777 | 119 |
| Traces | 1 | 266 | 8 |
| Log records | 49 | 55 | 82 |
| Metric datapoints | 40 | 222 | 1,460 |
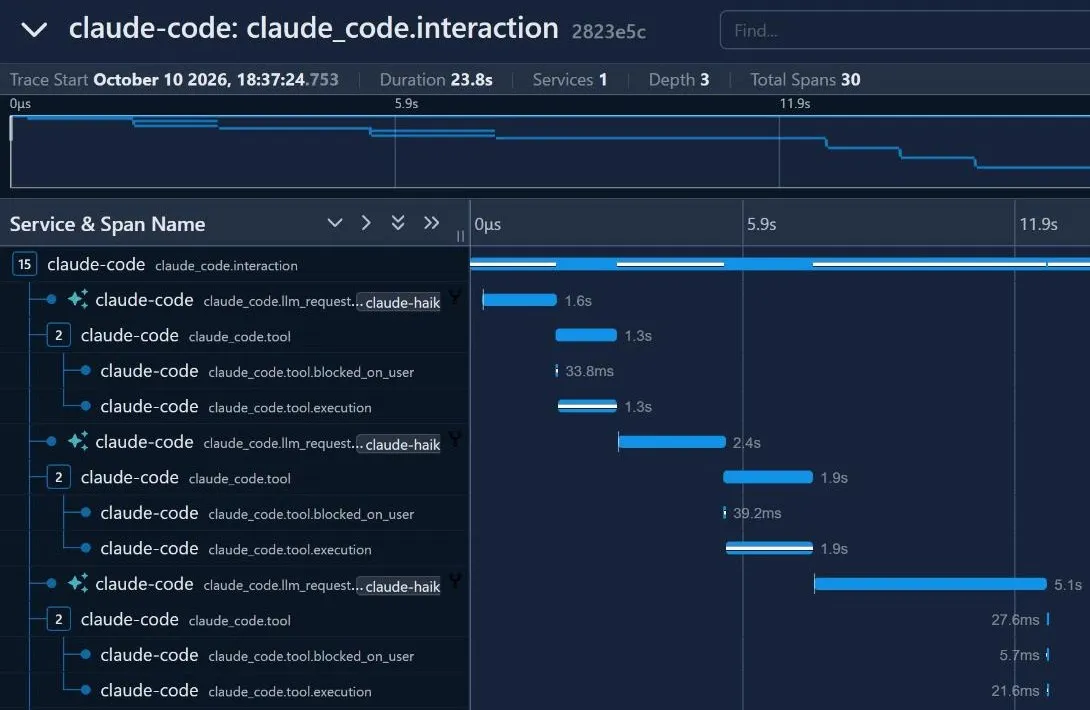
Claude Code produces one clean trace per prompt. An interaction span contains
llm_request spans and tool spans, and each tool span is split into
blocked_on_user (waiting for permission) and execution. LLM calls (1-5 s) and tool
calls (1-2 s) are on similar scales, so the waterfall reads like the agent’s loop: think,
act, think, act.
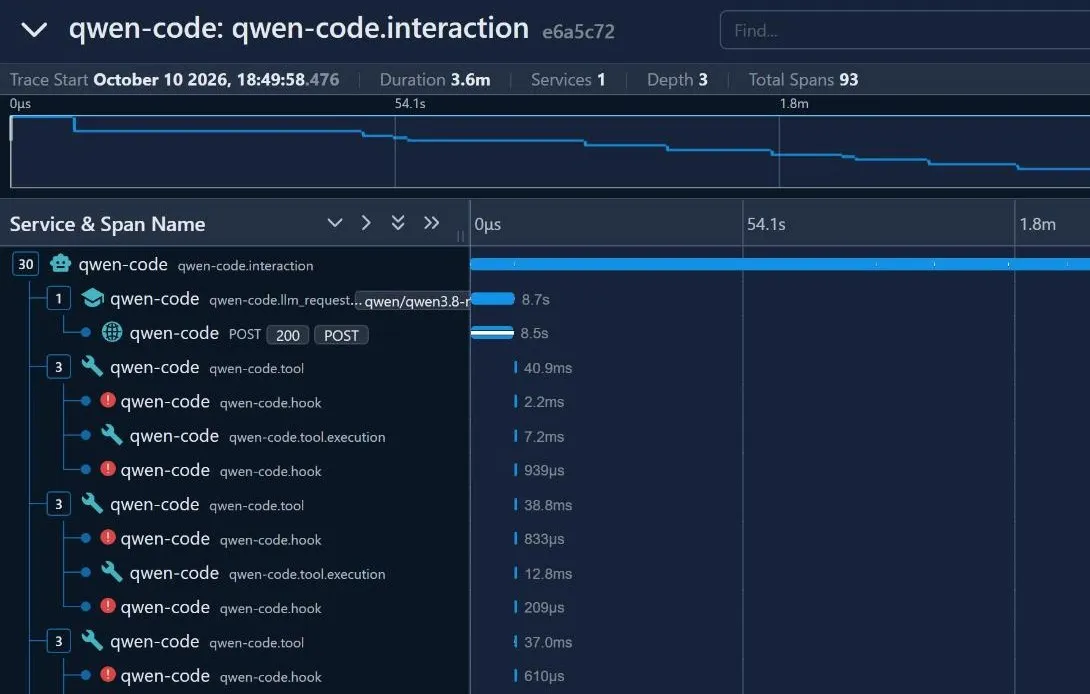
Qwen Code has the same basic shape, plus a few extras:
- Each LLM call gets an HTTP
POSTchild span (auto-instrumentation), and each tool call is wrapped in pre- and post-hookspans. - Every hook span is marked as an error, with the status message “hook runner returned no output without error detail”, even though I have no Qwen hooks configured. In one run that was 42 red spans for 21 tool calls (counting the memory extractor’s).
- Its LLM calls take 10-60 s, while the tools take milliseconds, so the tool rows shrink to slivers.
- Its background memory extractor runs after the main interaction, and every one of its spans is a separate single-span trace with no parent. Search for Qwen traces and you mostly get these fragments.
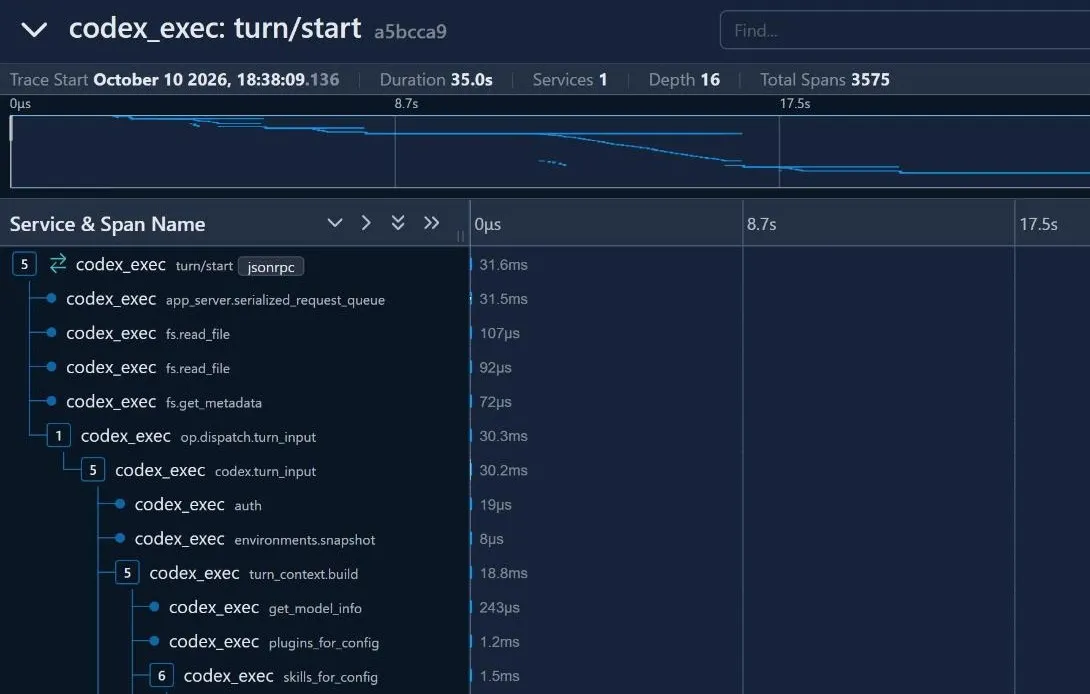
Codex exports its internal Rust instrumentation more or less wholesale. The useful
work sits in one trace rooted at a turn/start JSON-RPC span: 3,500-4,400 spans, nested 16
levels deep. Around it are another ~250 small traces per run (rollout persistence,
conversation-state polling, auth). Inside the turn trace:
- the model calls are timed by
run_sampling_requestspans (5-7 per run, up to 16 s each); - the token counts sit somewhere else entirely, on 20-50 ms
handle_responsesspans. There are about 1,000handle_responsesspans per turn, and only the 5-7 that close a response carrygen_ai.usage.*.
The spans carry attributes like code.file.path, code.line.number, busy_ns and
thread.name. That’s useful if you’re debugging Codex itself, and noise if you’re trying
to see what your agent did.
The attribute names diverge just as much. Mapped against the GenAI conventions:
| Concept (semconv) | Claude Code | Codex CLI | Qwen Code |
|---|---|---|---|
Agent run (invoke_agent) |
claude_code.interaction, no operation name |
session_task.turn, no operation name |
qwen-code.interaction, invoke_agent |
Model call (chat) |
claude_code.llm_request, no operation name |
run_sampling_request + handle_responses, no operation name |
qwen-code.llm_request, chat |
Tool call (execute_tool) |
claude_code.tool, no operation name |
dispatch_tool_call_with_state, no operation name |
qwen-code.tool, execute_tool |
| Provider | gen_ai.system (the deprecated name) |
none | gen_ai.provider.name |
| Tokens | input_tokens, output_tokens, cache_read_tokens, … |
gen_ai.usage.* |
gen_ai.usage.* |
| Conversation | session.id |
conversation.id |
gen_ai.conversation.id |
Of these three, Qwen Code is the only one that sets gen_ai.operation.name, and the only
one whose spans a GenAI-aware backend could understand without any remapping. Codex uses
the current token names but puts them on the wrong span, with no model or provider beside
them.
Claude Code uses its own names for almost everything.
The metrics differ just as much. Metrics are running totals and distributions for the whole run:
- Claude Code sends six product metrics: tokens, cost in USD, lines of code changed,
edit accept/reject decisions, active time and session count. Every series carries
session.idanduser.email, so each developer’s session gets its own time series. That makes per-person cost dashboards easy. - Codex sends 64. A handful describe the work: tokens per turn, time to first token, tool calls and their duration. The rest describe Codex’s own machinery, such as startup phases, SQLite, MCP and skill caches, and websocket events. It exports them as deltas, with no session or user tag.
- Qwen Code sends 16: API request counts and latency (with a per-phase breakdown), tokens, tool calls, file operations by language, auto-memory recall, and the process’s own CPU and memory. These aren’t tagged by session either. Every cumulative series is re-sent on each export, so the datapoint count grows with how long the run takes, and Qwen, the slowest, sends the most.
Without a session tag, Codex’s and Qwen’s metrics from different developers merge in a shared backend unless you add your own tag.
Finding 3: privacy defaults are all over the place
This is what lands in your collector with each agent’s default settings:
| Claude Code | Codex CLI | Qwen Code | |
|---|---|---|---|
| Prompt text | no (prompt=<REDACTED>, length kept) |
no (codex.user_prompt redacted) |
yes, in 13 log records |
| File contents | no | yes, in codex.tool_result arguments and output |
yes, in api_request and tool_call logs |
| Identity | user.email, user.id, account and organisation IDs on every span, log record and metric datapoint |
user.email, user.account_id on log events; host.name on resources |
none seen (with OpenRouter auth) |
- Codex’s
log_user_prompt = falseonly covers the prompt. Tool arguments and tool output are still exported, and that’s where file contents and shell output live. - Qwen’s defaults log prompts and API request text, which includes whatever it read.
It also includes the memory extractor’s work: its reads and writes of
~/.qwen/memories/, with your home-directory path, turned up in 17 log records in one run. So the default telemetry can carry what Qwen has remembered about you from other sessions, not just this task. - Claude Code redacts content by default, but it attaches your email to every metric datapoint. That’s a privacy question and a cardinality problem, because every user becomes a separate time series.
- Your setup leaks too. Plugin names, MCP server names and hook names show up as
attributes (Claude’s
plugin_loadedandmcp_server_connectionevents, Codex’s MCP spans). In my case that included an internal API hostname. - Deleting
user.*attributes isn’t enough. After stripping every identity key, Codex’s data still named my MCP servers and that hostname, and Qwen’s still had my username inside file paths. Scrubbing needs pattern-based redaction of values, not just dropping keys.
Each agent can be made more or less verbose. Claude Code has OTEL_LOG_USER_PROMPTS,
OTEL_LOG_TOOL_DETAILS and friends, and Qwen Code has logPrompts and
includeSensitiveSpanAttributes. Turn everything on and all three will happily export
whole conversations. But defaults are what most people run, and right now “default”
means something different for each agent.
Finding 4: what you can learn from it
Why is Qwen so slow?
The matched-tier runs took a median 24.5 s for Claude Code, 35 s for Codex and 216 s
for Qwen Code. Qwen’s own spans explain why, because its llm_request spans carry time to
first token, output tokens per second and thinking-token counts:
| Per run | Qwen Code + Qwen3.8 Max | Claude Code + Haiku 5.5 |
|---|---|---|
| Time generating output | 147-190 s | ~13-17 s |
| Output speed | ~41 tokens/s | ~255 tokens/s |
| Output tokens | 6.3k-7.9k, 51-60% of them thinking | 3.3k-4.6k |
| LLM requests | 12-14 | 5-8 |
| Total time to first token | 28-35 s (~2.4 s per request) | 3-5 s |
| Time in tools | 4-7 s | 5-7 s |
Qwen spends about 80% of its run generating tokens, slowly, and more than half of them are reasoning. It also makes twice as many round trips, because it reads more files before it acts. It isn’t the agent. Nothing was retried, tools took seconds, and the same agent on Qwen3.8 Flash finished in 68 s. I couldn’t tell whether ~41 tokens/s is normal for this model, because OpenRouter routes it only to Alibaba’s own endpoints and their published throughput stats were empty.
You can do this diagnosis from the spans alone, with no other tooling. Claude Code’s spans carry ttft_ms and token counts, so they support
the same breakdown. With Codex you’d have to join the run_sampling_request timings to
the token counts on a different span.
Do the agents’ own numbers add up?
Each agent reports usage in several places (span attributes, log events, metrics, and the CLI’s own output), so you can check each agent against itself.
- Claude Code is consistent. The number of
llm_requestspans matches the number ofapi_requestlog events, and the summedcost_usdmatches the CLI’s own reported cost to the last digit. It’s also the only agent that reports cost at all (about $0.008 per run on Haiku). - Codex’s CLI summary undercounts. In an earlier run on GPT-6 Astra, it printed
tokens used 10,433. That’s non-cached input (9,326) plus output (1,107). The telemetry total was 88,257, because it counts the 77,824 cached input tokens too. - Qwen’s totals include its memory extractor. In one run that was 3 of 9 requests and about a fifth of the input tokens. The CLI’s JSON output splits this out; the telemetry doesn’t, so you have to separate it by trace.
- “Input tokens” means three different things. Claude’s
input_tokensexcludes cache reads (12 input against 195,633 cache-read in a typical run). Codex’s and Qwen’sgen_ai.usage.input_tokensinclude them (88,269 including 79,616 cached; 383,534 including 339,328 cached). Add up “input tokens” across agents on a dashboard and you’re comparing different quantities.
So what?
If you run these agents across a team:
- Turn on traces explicitly. Claude Code needs
CLAUDE_CODE_ENHANCED_TELEMETRY_BETA=1plus a traces exporter, and an explicitOTEL_EXPORTER_OTLP_PROTOCOL. Without that it exports nothing at all. - Decide about logs on purpose. That’s where Qwen’s prompts and Codex’s file contents
go. Set Qwen’s
logPromptstofalseunless you really want them. - Expect your developers’ local setup in the data: plugins, MCP servers, hooks, usernames in paths.
- Put a collector in front of any backend, and scrub values there, not just keys. Part 2 has the config.
Next: lost in translation
I looked at all of this in the most neutral setup available: a local collector writing files, plus Jaeger. Part 2 sends the same data to Jaeger’s GenAI view and to Pydantic Logfire, and compares three more hosted backends (LangSmith, Langfuse and Braintrust) from their docs. There, the attribute names suddenly matter a lot. So does which signals each backend accepts, because a traces-only backend never sees the logs where Qwen’s prompts and Codex’s file contents live. It also shows how to replay captured OTel data to any backend without re-running anything, and what happened when I did.
Addendum: DeepSeek Harness (12 October 2026)
Afterwards I put a fourth agent through the same kit: DeepSeek Harness (dsh 0.1.2-rc.1),
with LoongSuite’s new OpenTelemetry plugin (@loongsuite/dsh-plugin 0.1.3). It was one run
per privacy mode, on x-ai/grok-4.7 via OpenRouter (my DSH default), so it isn’t tier-matched
and the numbers are anecdotes. The notes are in the repo’s FINDINGS-dsh.md.
Two exporters, from two companies. The plugin comes from LoongSuite, an Alibaba
observability project, and sends traces and metrics. DSH also ships DeepSeek’s own exporter,
which sends logs: the raw, unredacted session log. It’s on by default in a “feedback only”
mode, aimed at DeepSeek’s own endpoint, and uploads when you use /feedback. So the part
that follows the conventions comes from Alibaba, as with Qwen Code.
| Spans | Traces | Log records | Metric datapoints | |
|---|---|---|---|---|
| DeepSeek Harness | 22 | 1 | 0 (56 with everything on) | 3 |
The cleanest trace of the four:
enter_ai_application_system
  invoke_agent deepseek-harness
    react step
      chat x-ai/grok-4.7
execute_tool read / edit / pwsh ...- Every span sets
gen_ai.operation.name, and the provider isgen_ai.provider.name. - The tokens sit on the
chatspan, next to the model. - With content switched on, it uses the current names:
gen_ai.input.messages,gen_ai.tool.call.argumentsand so on. - The only metrics are the two standard GenAI histograms.
That’s four of the five changes on my wish list above. The miss is background work, below.
It isn’t perfect:
- Time to first token is
gen_ai.response.time_to_first_token, in integer nanoseconds. The conventions saygen_ai.response.time_to_first_chunk, in seconds. - The turn’s token totals are repeated on
invoke_agent, so anything that sums every span counts them twice. - One model call isn’t traced at all: DSH asks the model for a session title, sending your prompt, and only DeepSeek’s own logs record it.
- “Input tokens” means two things inside one agent: the plugin’s figure includes cache reads, and DSH’s own logs exclude them.
Privacy: content-free by default. There’s no prompt, no file content and no email. The one thing to watch is the full working-directory path on every span, which for most people contains their username.